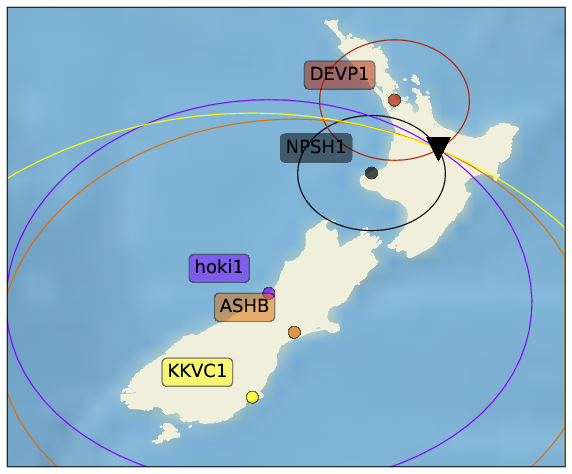
The “textbook” method to estimate the epicentre of an earthquake is based on the arrival time difference between the primary and secondary seismic wave. From this time difference, we can estimated the distance from the station to the earthquake; in other words, from a single station, we know the earthquake happened anywhere on a circle centered on the station, where the radius is the estimated epicentral distance. The intersection of at least three station’s circles provides an estimate of the epicentre.
circles centered on each seismic station represent the epicentral distance to an earthquake. The intersection of all circles is at the epicentre.
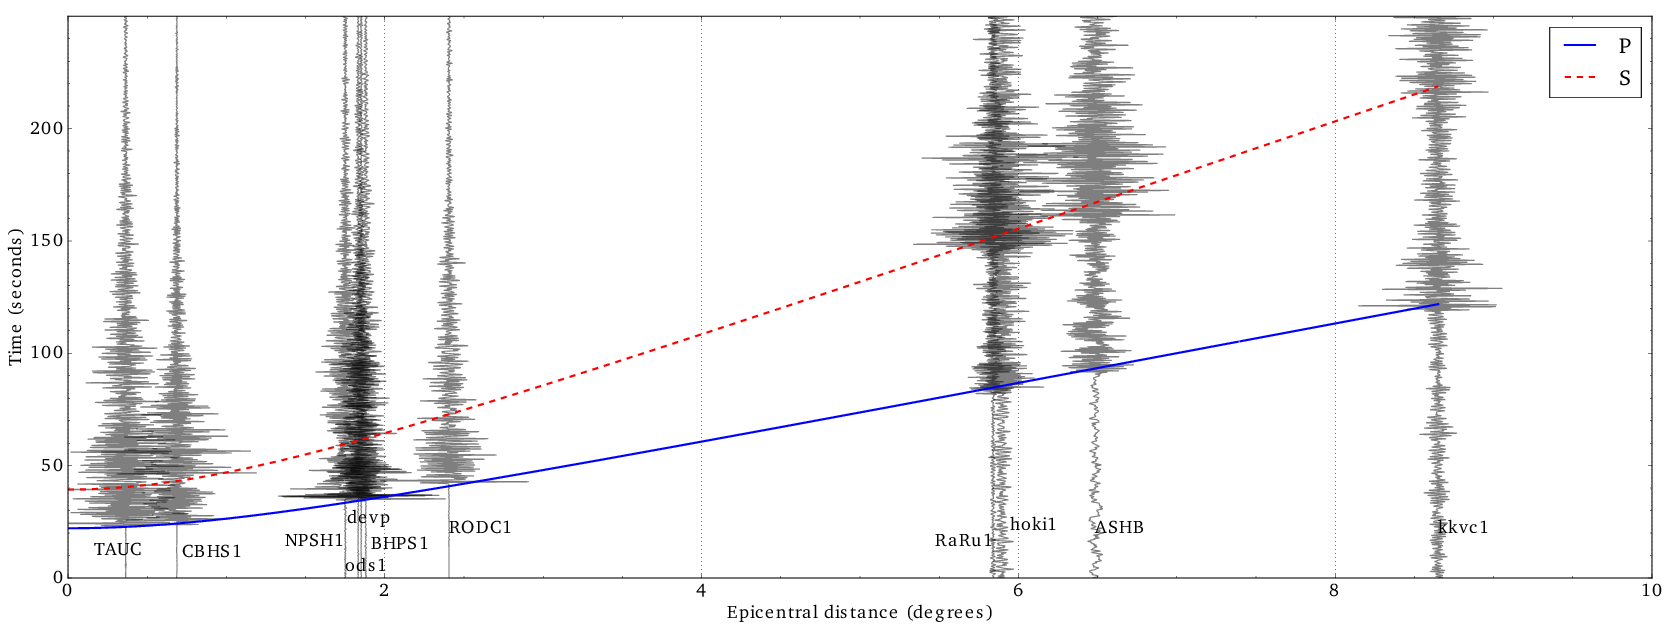
But how do we get the radius for each circle? In the figure below, you can see the seismograms from several of the Ru seismic stations for an earthquake near Rotorua, plotted as a function of their distance to Rotorua. The red and blue curves are predicted arrival times for the primary and secondary wave, based on a spherically symmetric earth. We made this figure for a publication in the European Journal of Physics, but the jupyter notebook that generates these figures is available here.
The distinct arrivals of the primary and secondary wave are matched with the arrival time curves predicted for a spherically symmetric earth.
Earthquakes occur on fault lines. Faults are fractures in the Earth’s crust formed by stress due to tectonic plates grinding together. When the stress builds high enough, the crust ruptures, causing an earthquake and a fault is formed. The Earth’s crust is displaced on either side of the fault.
Labelled Fault. (n.d.). Retrieved March 22, 20016, from http://earthquake.usgs.gov/learn/kids/eqscience.php
Faults are often only observed under the Earth. But we can sometimes see them on land too!
Go to google maps (or google Earth) and locate the following features:
Wallace Creek, California (USA). You can input the coordinates 35.27189, -119.82741 . Identify the rivers and look at their shape. Are the river shaped as you expect? Could a fault have changed the river shape/direction? Can you identify the fault?
Alpine Fault (New Zealand). Input the following coordinates: -42.6834, 171.5686 and zoom out.
Look at Earth features that stop abruptly. Can you identify the famous Alpine Fault? The Alpine Fault created the Southern Alps. How do you think the Earth moved along the fault to create the Alps?
Take a look at the East African Rift Valley (input coordinates 6.462, 37.908 and zoom out (really far). Can you see the rift stretching from Ethiopia to Mozambique? Here plate tectonics are acting to split one plate into two new ones. Can you think how faults might allow a valley like this to form? What might Africa look like in another 30 million years? Look at the shape of the Great Lakes along the rift valley (Lake Turkana, Lake Malawi). Can you think why they might be elongated?