All posts by jsim921

Seismic Interferometry: Some Real Science with our Seismometers

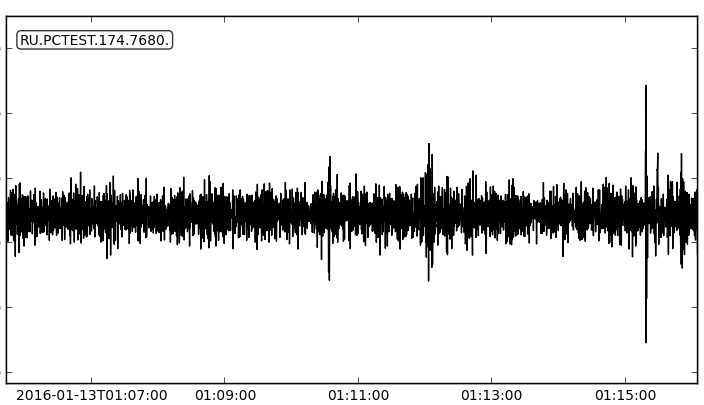
The TC-1 seismometers in the Ru network are continuously recording small vibrations of the Earth. When these vibrations are seen on a seismogram they are called ‘noise’.  Recently, we have been extracting useful information from the noise recorded by  TC-1 seismometers in the Ru network using a technique called seismic interferometry.

Random vibrations of the Earth are seen as noise on a seismogram.

Noise can be thought of as a collection of seismic waves of different frequencies all stacked on top of each other to create a somewhat random signal–the same as sound noise, but with a much lower, inaudible average frequency.  Because New Zealand is an island country surrounded by large oceans, a significant component of the low frequency noise comes from the interaction of the ocean with the seafloor and the land. Seismic interferometry analyses this noise and reveals evidence for surface waves generated by such a source which propagate through the Earth.

Ru stations used for the seismic interferometry. Ocean noise from the west coast that is recorded at all three stations will travel along the green line.
Ru stations in Auckland used for the seismic interferometry. Ocean noise from the west coast that is recorded at all three stations will travel along the green line.

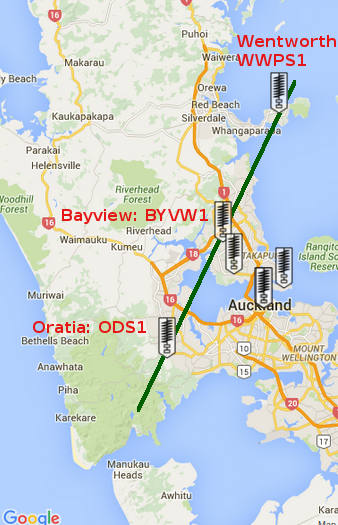
The stations best suited for this analysis are those in coastal regions which form a near straight line between coasts when connected, such as those at Oratia District School (ODS), Bayview Primary School (BYVW), and Wentworth Private School (WWPS). The coastal environment of the Tasman Sea on the west of New Zealand is known to have higher energy than that on the east coast, so surface waves generated by the ocean-land interaction on the west coast which propagate east should be recorded in the seismic noise. And that’s exactly what the seismic interferometry with this data has revealed!

Oratia to Wentworth cross-correlation. A low-pass digital filter with a cut-off frequency of 0.55 Hz was applied to the data in these analyses to remove significant influence from higher frequency noise, as the typical frequency of ocean noise is below 1 Hz.
Oratia to Wentworth cross-correlation (33 hours). A low-pass digital filter with a cut-off frequency of 0.55 Hz was applied to the data in these analyses to remove significant influence from higher frequency noise, as the typical frequency of ocean noise is below 1 Hz.

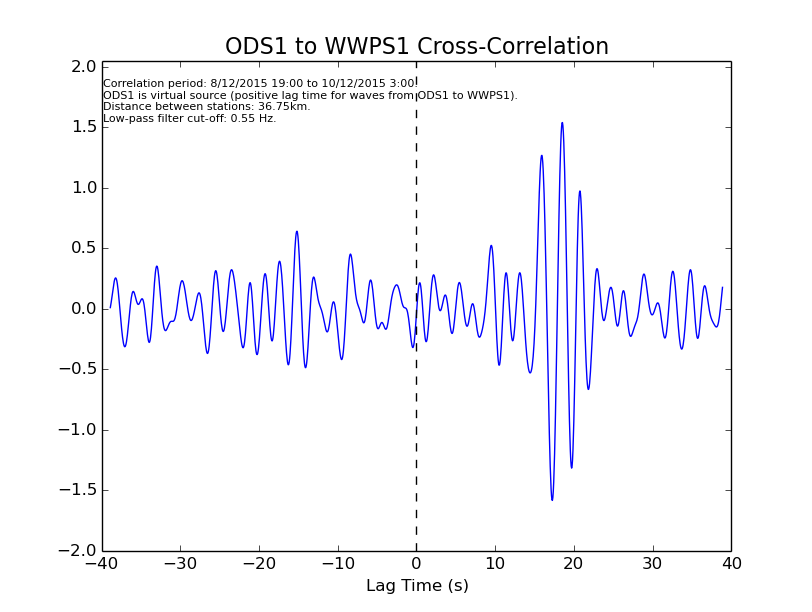
The figure above shows the same as what you would see when looking at a normal seismogram, with time on the x-axis and amplitude of the signal on the y-axis. However,  on the positive side of the x-axis, this plot shows Wentworth’s recording of an “earthquake” which occurred at 0 seconds at Oratia (and vice versa for a negative lag time). Of course, an earthquake never actually happened, but the cross-correlation uses the recorded noise over a long period to show what the signal might look like if an earthquake did occur (this is why ODS1 is the “virtual” source). The large peak at a time of about +15 to +25 s shows that a large component of the noise recorded at Wentworth takes 15-25 seconds to travel the distance from Oratia. The distance between the stations is 36.75 km, so waves which take 15-25 s to travel between Oratia and Wentworth propagate at about 1.5-2.5 km/s, a typical velocity for surface waves! A region of higher amplitude at -15 s to -25 s probably indicates surface waves travelling in the opposite direction, from the east coast to the west coast.
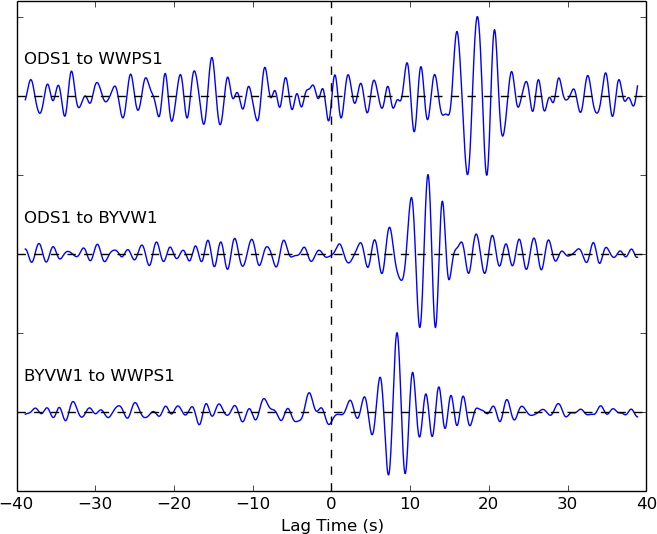
Similar results are obtained by cross-correlating the data between Oratia and Bayview, and Bayview and Wentworth. Since Bayview is at approximately the halfway point of the distance between Oratia and Wentworth, these two cross-correlations show the large peak at about half the lag time.

Cross-correlations of all three stations shown on the map above. The 2nd is over a period of 77 hours, and the third is over 79 hours.

While seismic interferometry can be used by seismologists to investigate properties of the subsurface (e.g. seismic wave velocities), our positive results demonstrate that data from the TC-1 seismometers in the Ru network is capable of being analysed in the same way as data from dedicated research-grade seismometers.

Thanks to all the station managers who have sent us their data, including those whose stations are not mentioned here (it’s a work in progress!).


Running Jamaseis on Linux

Unlike on Windows or Mac OS, jAmaSeis does not autodetect the serial port where a seismometer is connected on Linux. To run jAmaSeis on Linux, the jAmaseis.jar file must be started from the terminal with the correct serial port passed as a parameter. For the Arduino in the TC-1, this port will be /dev/ttyACM0 (or sometimes 1,2,3… instead of 0). The command to start jAmaSeis is:

java -Dgnu.io.rxtx.SerialPorts=/dev/ttyACM0 -jar jAmaseis.jar

It should also be noted that the Arduino drivers must be installed to read data sent by the TC-1. The easiest way to do this is by installing the Arduino IDE which will automatically install the appropriate drivers.

Since jAmaSeis is written in Java, a Java runtime environment must also be installed to run the .jar file. For example, OpenJDK.

Arduino Weather Station

This Arduino ‘weather station’ acts as an example of the functionality of the Arduino microcontroller (which is used in the TC-1). It was presented at the recent Ru workshop as an “Arduemo” (!?) and is a nice little project for those with little or no experience in wiring or coding the Arduino. Here is a picture showing the layout of the circuit:

Arduino weather station with temperature, humidity, and pressure sensors as well as anemometer to measure wind speed.
Arduino weather station with temperature, humidity, and pressure sensors as well as an anemometer to measure wind speed.

The temperature/humidity and pressure sensors are Arduino-compatible modules from freetronics, while the anemometer is ‘home-made’ from two ball bearings in a brass casing with a steel shaft and windcups (see specifications). The anemometer sensor is a magnetic reed switch from a bike computer, so the Arduino simply watches for when the switch is opened and closed. A closer look at the individual components and wiring of the circuit can be found here.

This project is very flexible and could be modified to include many more sensors. My version of the Arduino sketch and a Python script to display the data on a computer are just one example of how the data can be read and processed.

Hundreds more Arduino examples and a huge number of helpful Arduino tips can be found at the Arduino playground: http://playground.arduino.cc/

The Ru Network on a pcDuino

A pcDuino is a ‘microcomputer’ which works the same as a normal desktop computer but is many times smaller. pcDuinos integrate well with the arduino board currently used in the TC-1 seismometer, so they make  a cost-effective alternative for computers in the Ru network.

The pcDuino microcomputer. The wires connected are power and HDMI output (right) as well as keyboard, mouse, and TC-1 (via USB hub). The length of the board is about 12cm.

The pcDuino runs the Linux-based operating system Lubuntu, which supports both the jAmaSeis and PyjAmaSeis software. Work is currently being done on the pcDuino and the software it runs so that we can use them in the Ru network sometime in the future.

A pcDuino running the PyjAmaSeis software.

PyjAmaseis

PyjAmaSeis is free software to record, display and process seismic data from your seismometer attached to a computer. The first version was developed by Saketh Vishnubhotla as part of his 4th year BTech (Hons) project at the University of Auckland.

PyjAmaSeis was inspired by jAmaseis (which was developed based on the succesful AmaSeis software), and is written in Python, a versatile programming language with interpreters available across operating systems.

Screenshot of PyjAmaSeis version 1.0 running on a pcDuino (see pcDuino and Linux category).

PyjAmaSeis uses a lot of the features developed as part of obspy, and we hope to develop a graphical user interface for teachers and students in the near future.