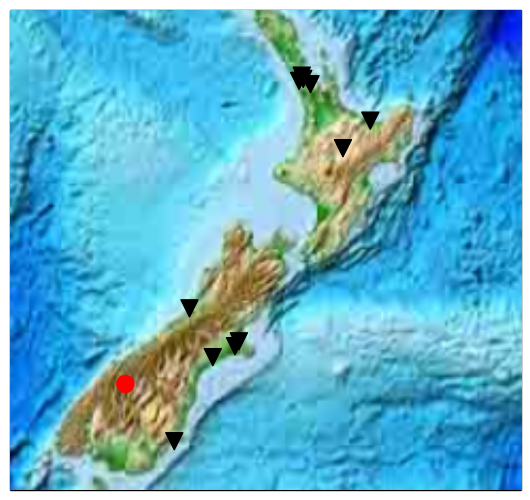
On May 4, 2015, at 2:29:10 UTC, an earthquake with magnitude 5.8 occured 30 km north-west of Wanaka. Most of the TC1 seismometers of the Ru network recorded the resulting seismic waves. Check out the map below, where the epicentre of the quake is shown as a red dot, and the stations in the Ru network are shown as black triangles.
The records of the earthquake motion are called seismograms. Each “seismogram” is a record of the velocity of the earth at a particular time. In the figure below, the seismograms are offset horizontally from the left of the graph. This offset is the epicentral distance (distance from the epicentre) to each station. The vertical time scale starts at the origin time of the earthquake.
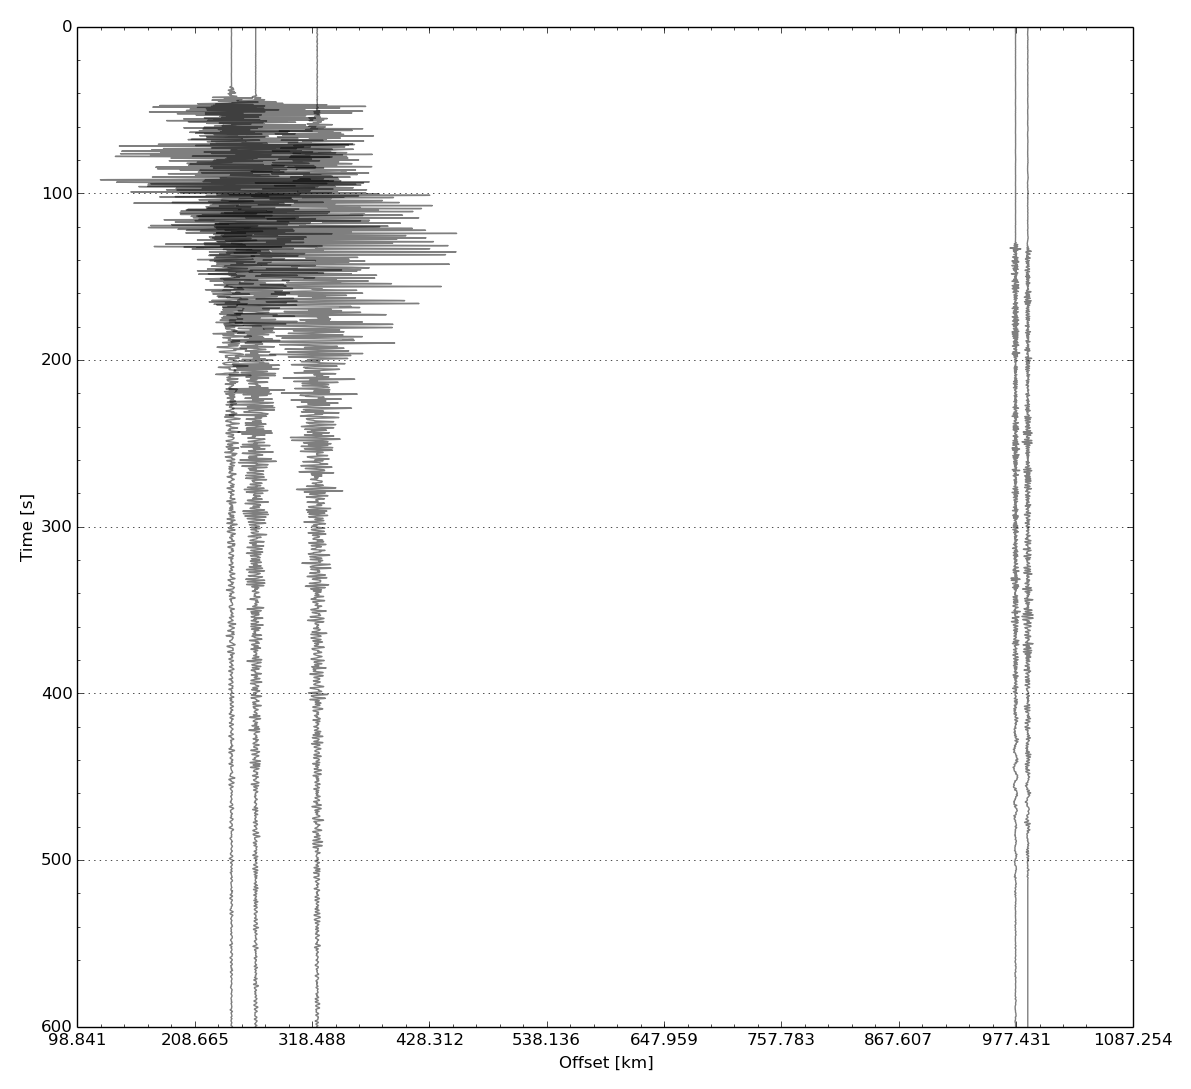
There are two important things to notice about this figure. First of all, Hokitika, Rangi-Ruru, and Ashburton museum stations are the closest to the earthquake and have very similar epicentral distances. Therefore the the earthquake reaches them at close to the same time, and the stations are spaced close together on the horizontal axis. Also, notice that these seismograms have large amplitudes and overlap each other. By contrast, the two stations further away, in Auckland, record the earthquake at later times. The amplitude recorded on these stations is also smaller, which makes sense because seismic waves spread out as they travel greater distances.
To see the waveforms more clearly, here is a simple plot of what all stations recorded. Note that the vertical scale of the different plots is not consistent from plot to plot:
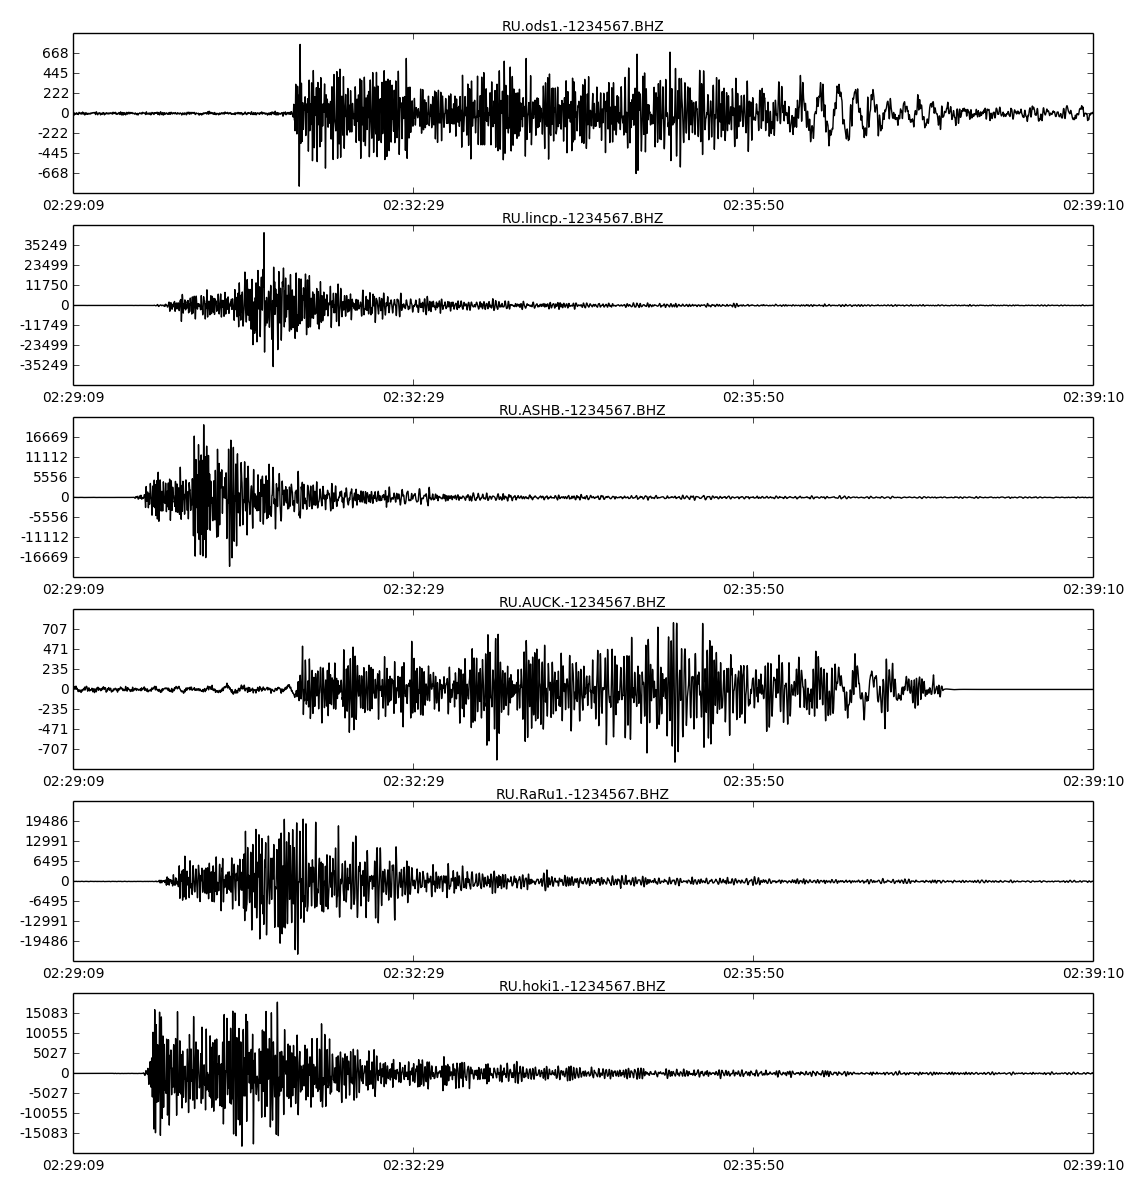
Also note that these plots do not look the same. This is the result of path effects. To begin with, as seismic waves travel through the earth, the earth attenuates (makes smaller) certain frequencies more than others, and which frequencies it attenuates depends upon which path the quake travels. Since the waves took different paths to make it to our different stations, the recorded earthquakes look different. But this is only part of the picture. Notice that at the two stations which are further away, the seismograms are longer. In addition to the primary wave (the fastest, which arrives first), there are other, slower waves that arrive later. The further a station is from the epicentre, the longer it takes for all the waves to arrive, and therefore the recorded quake is longer.
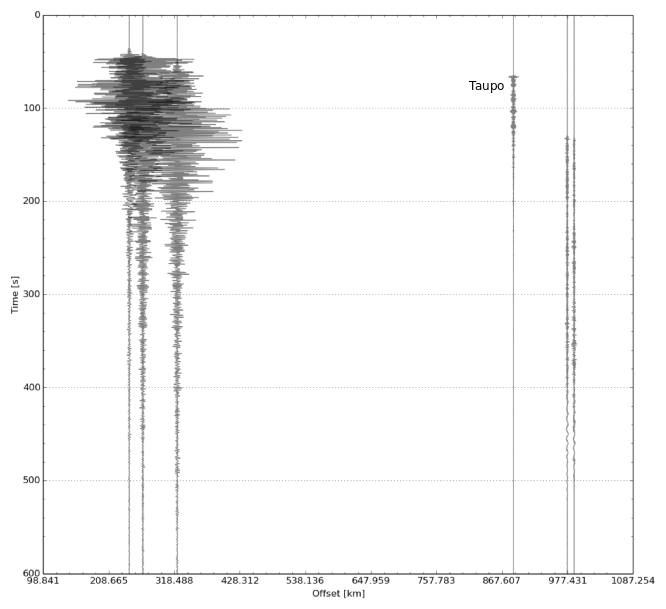
And lastly, here’s a seismic section with data from our Taupo station included. As you can see, it looks like the earthquake arrives a bit before it should. The computer clock for this station was not accurate, which shows how important it is for professional seismologists to make sure their clocks are set right! (of course we at Ru understand that’s not always possible with the equipment we provide you).
Thank you to all the station managers who sent me data! If you haven’t yet sent me your data, please do, and I can update the figures!