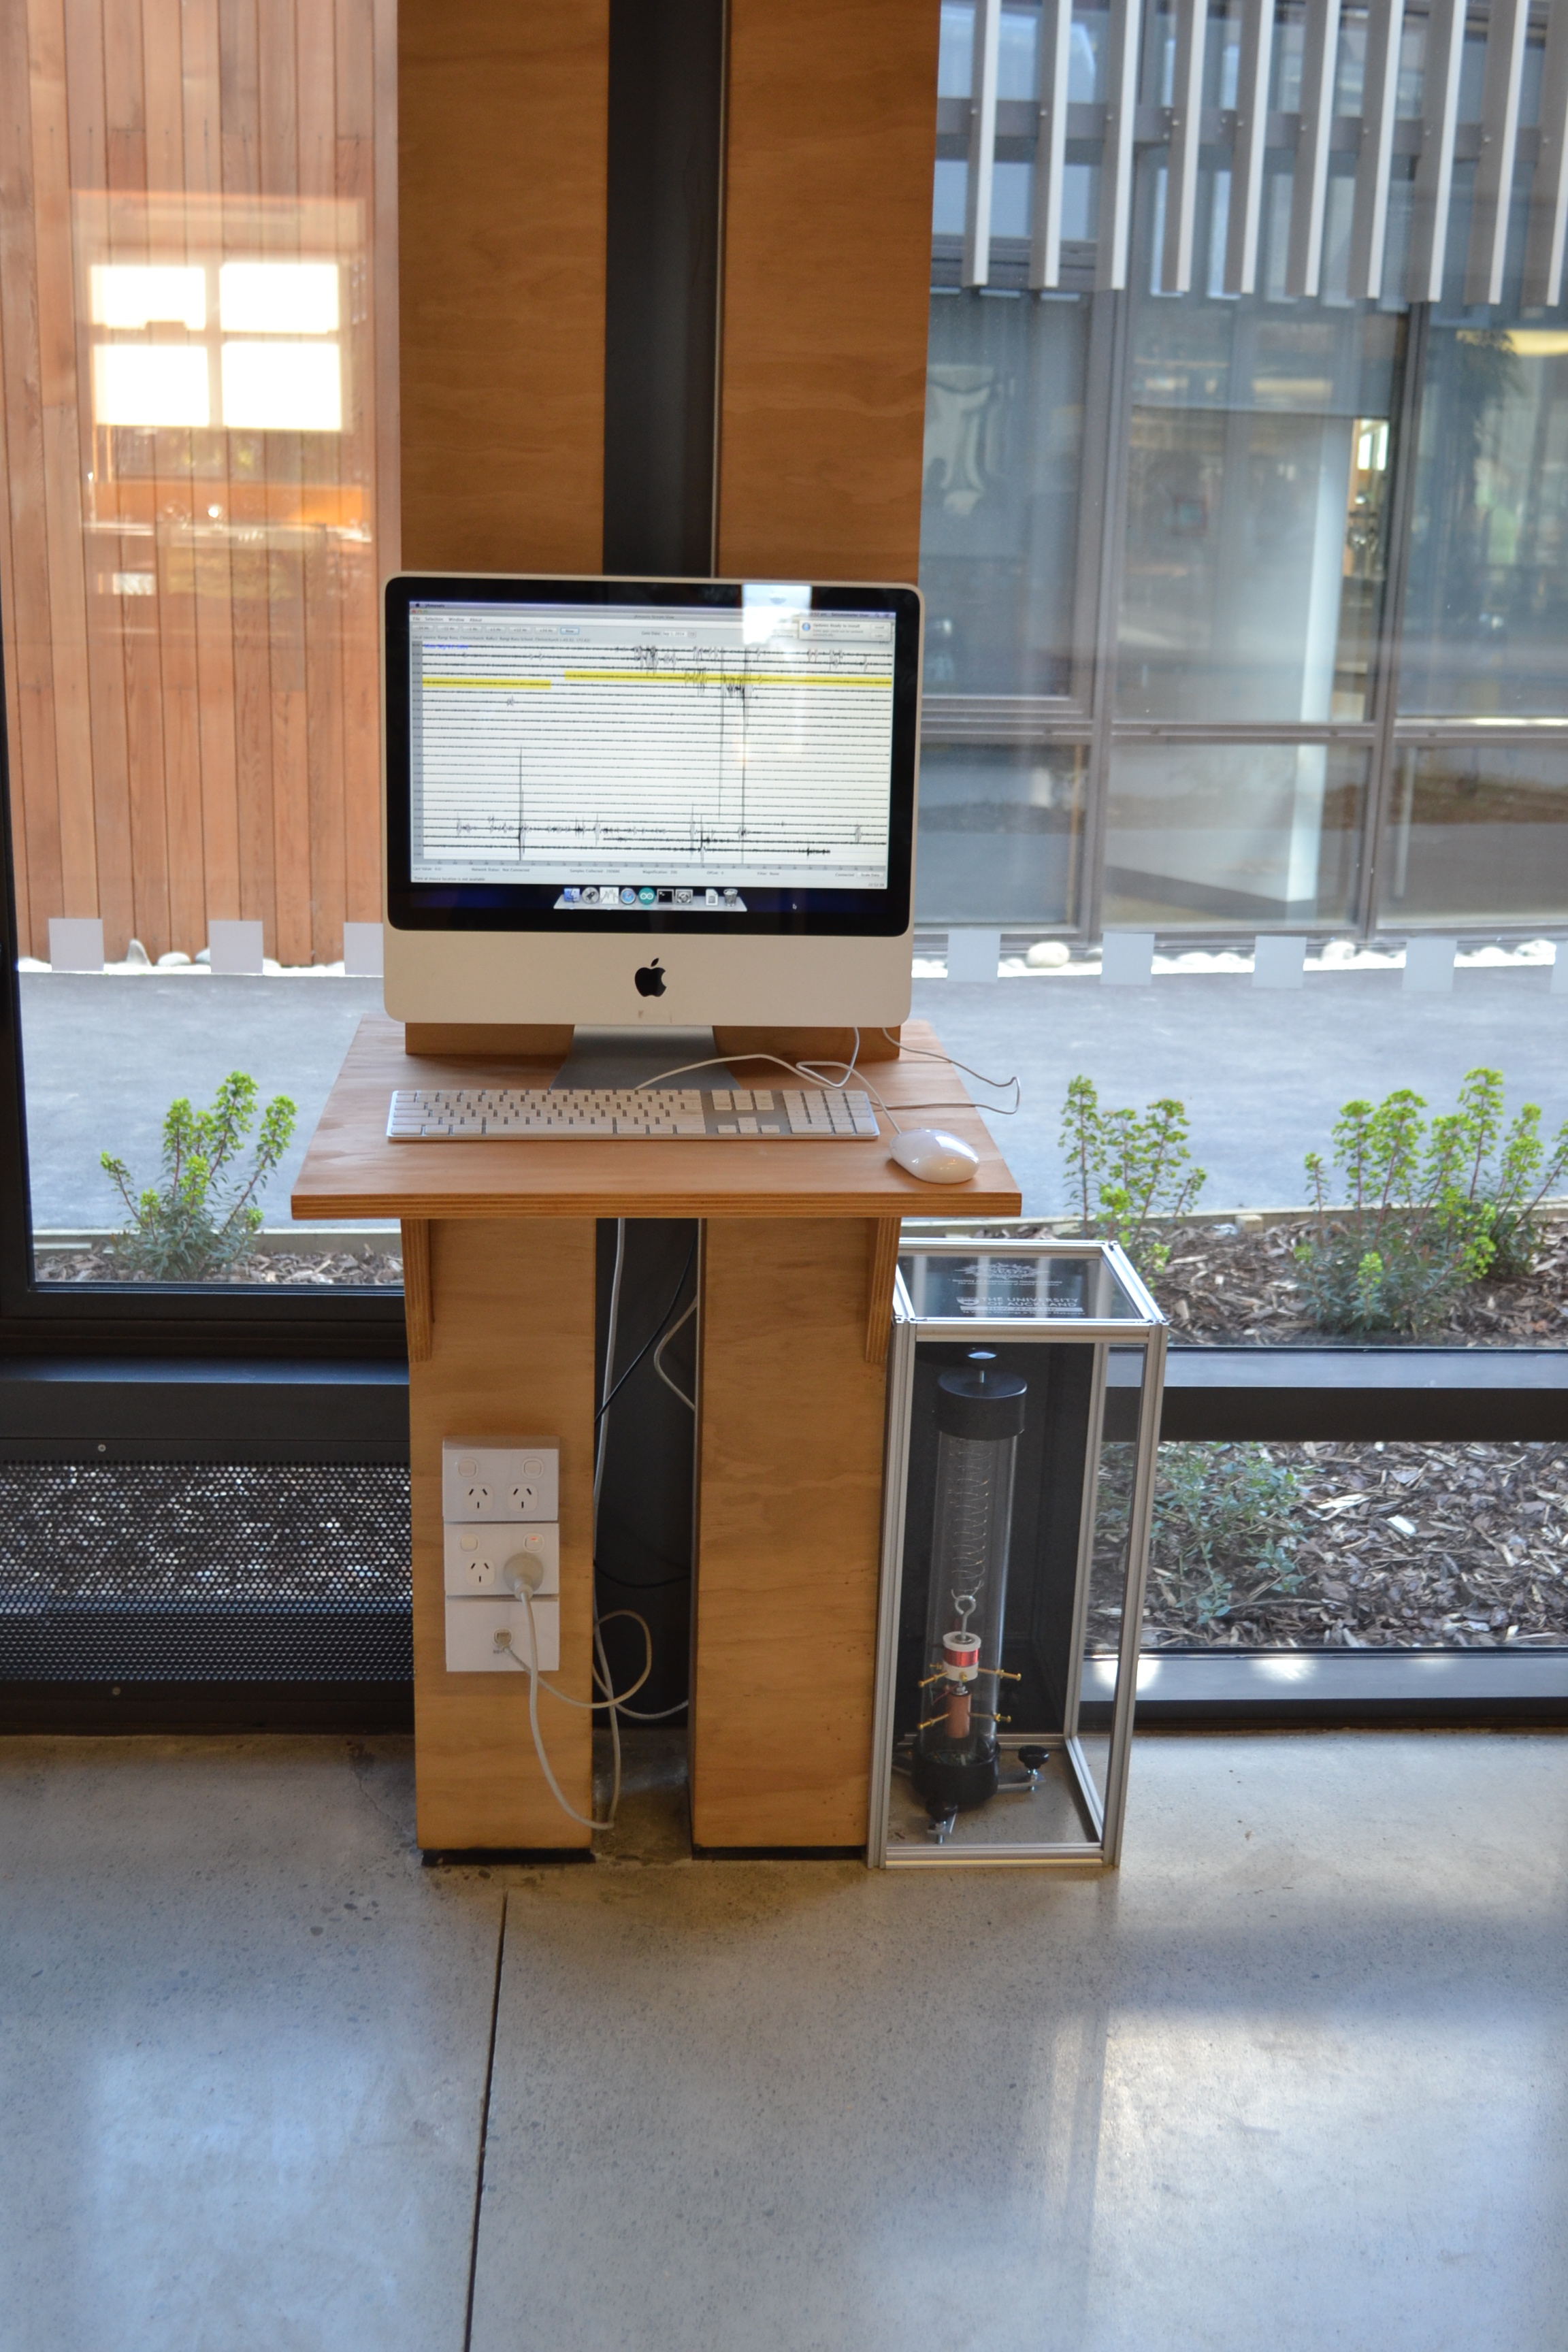
If all is well, you received a TC1 seismometer, a computer with everything installed, and a flat-packed protective case.
- Unpack the computer and TC1. Plug the power, the usb keyboard/mouse and ethernet cable into the computer.
- Connect the TC1 to the computer with the USB cable in the USB port marked “TC1.”
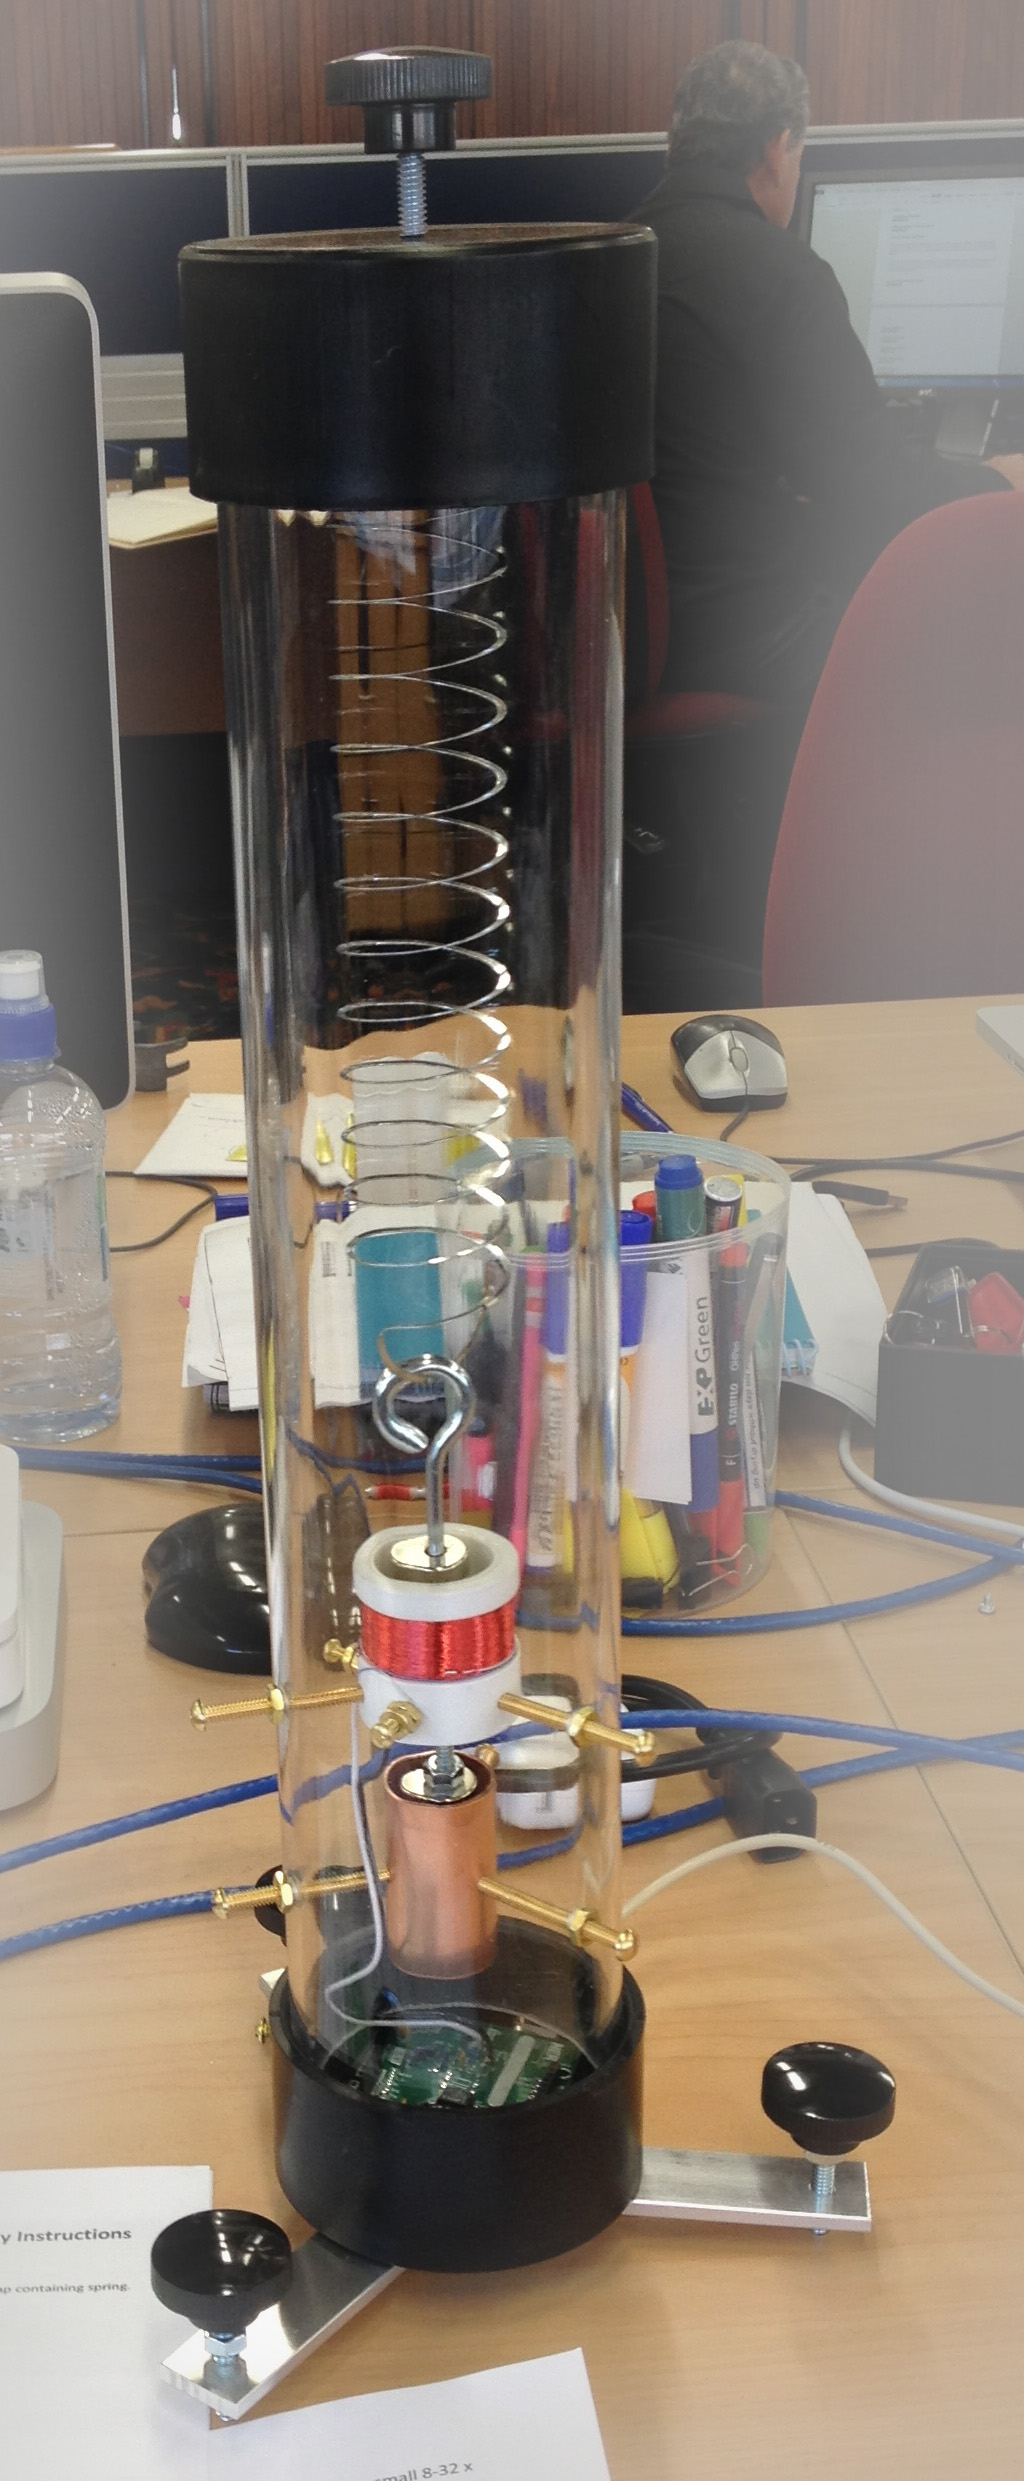
- Hook the magnets to the slinky attached to the inside of the top cap of the TC1.

- Lower the magnets into the tube so that the bottom magnet is inside the copper damping ring and the top magnet is inside the coil.
- Level the magnets with the three knobs on the legs. The goal is to make sure the magnets do not touch the rings.
- Also, make sure the top of the magnets are flush with the top of the copper ring and coil, respectively. Small adjustments to the vertical position of the magnets can be made with the knob on the top lid.
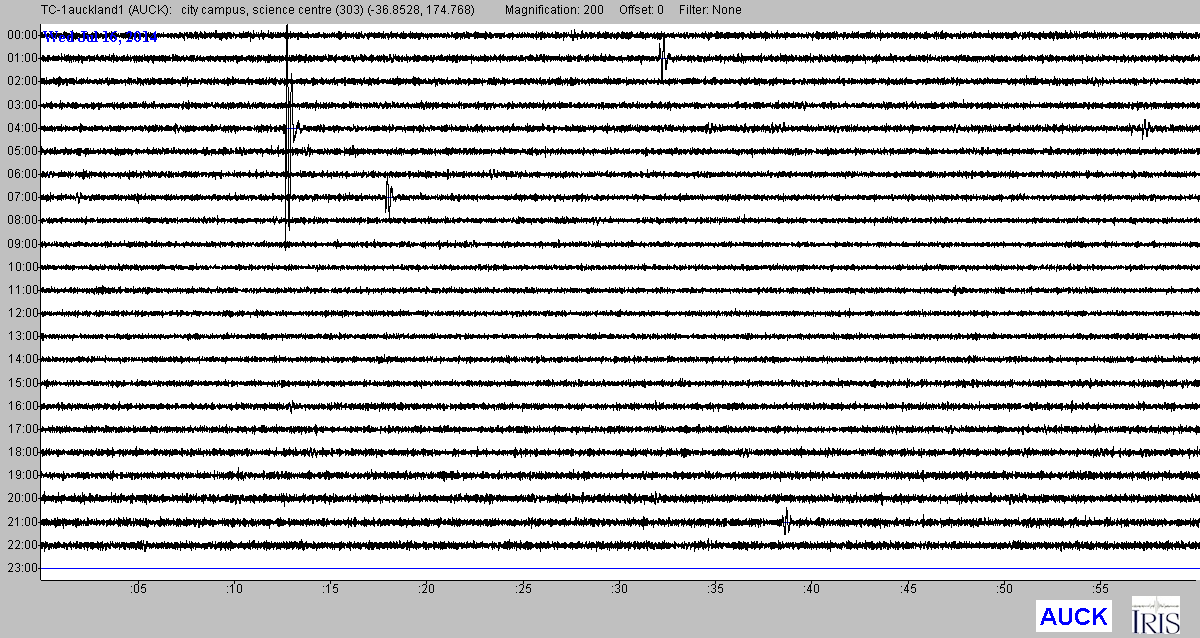
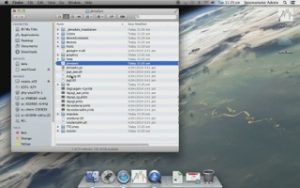
Now turn on the computer. All the necessary software to display your seismic data will turn on automatically. The most recent versions of the station software include a standard slide-show that explains the TC1, has acknowledgements, a map of NZ latest earthquakes (data courtesy of geonet), and the seismic data from your station.
You can turn the slide show on and off in the bottom
control panel. Just go the bottom of the screen with your mouse, and the button will appear.
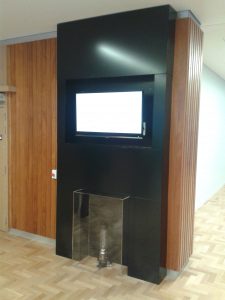
Next, we assemble the case, and place it over the TC1. We recommend fastening the case to a wall, or to the floor.
Congratulations! You are up and running! If you have any questions or comments, please feel free to contact us using the mailing list on the left.
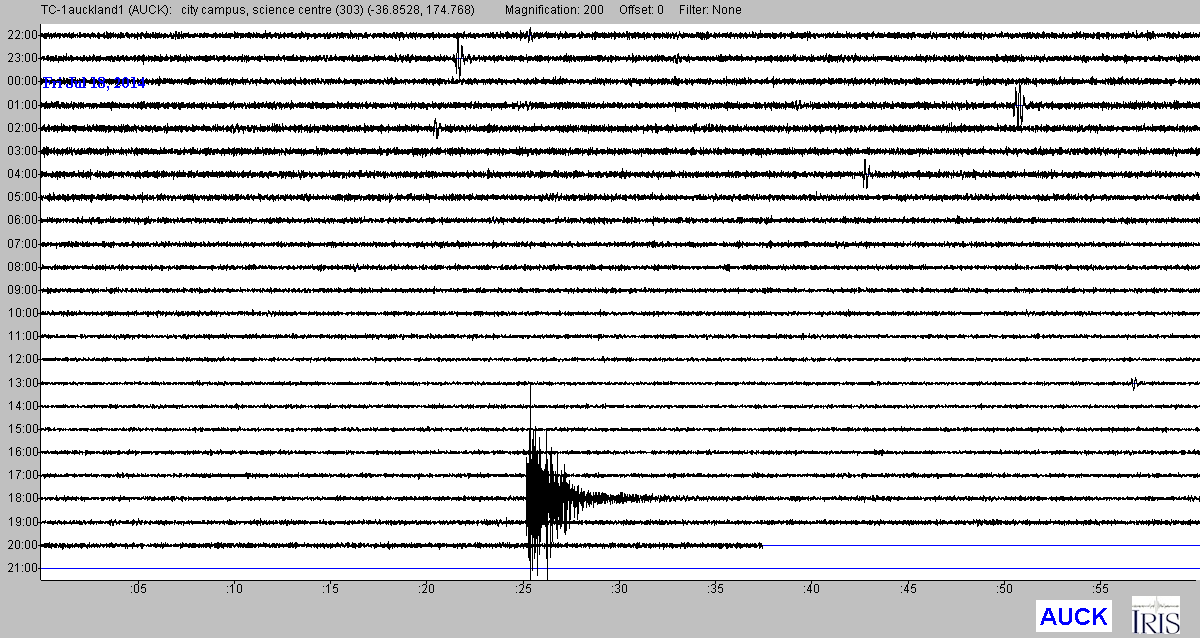
Soon, you will see your first signals!