In the last two days, we had two very large earthquakes. In Myanmar, a magnitude 7.7 earthquake caused devastation, not only in Myanmar, but also in the region. The vast majority of earthquakes happen on plate boundaries, and this event was no exception. At the largest scale, the cause of earthquakes in the region is the collision between the Indian and Eurasian plates,. This is the same collision that is responsible for the Himalaya’s to the Northwest.
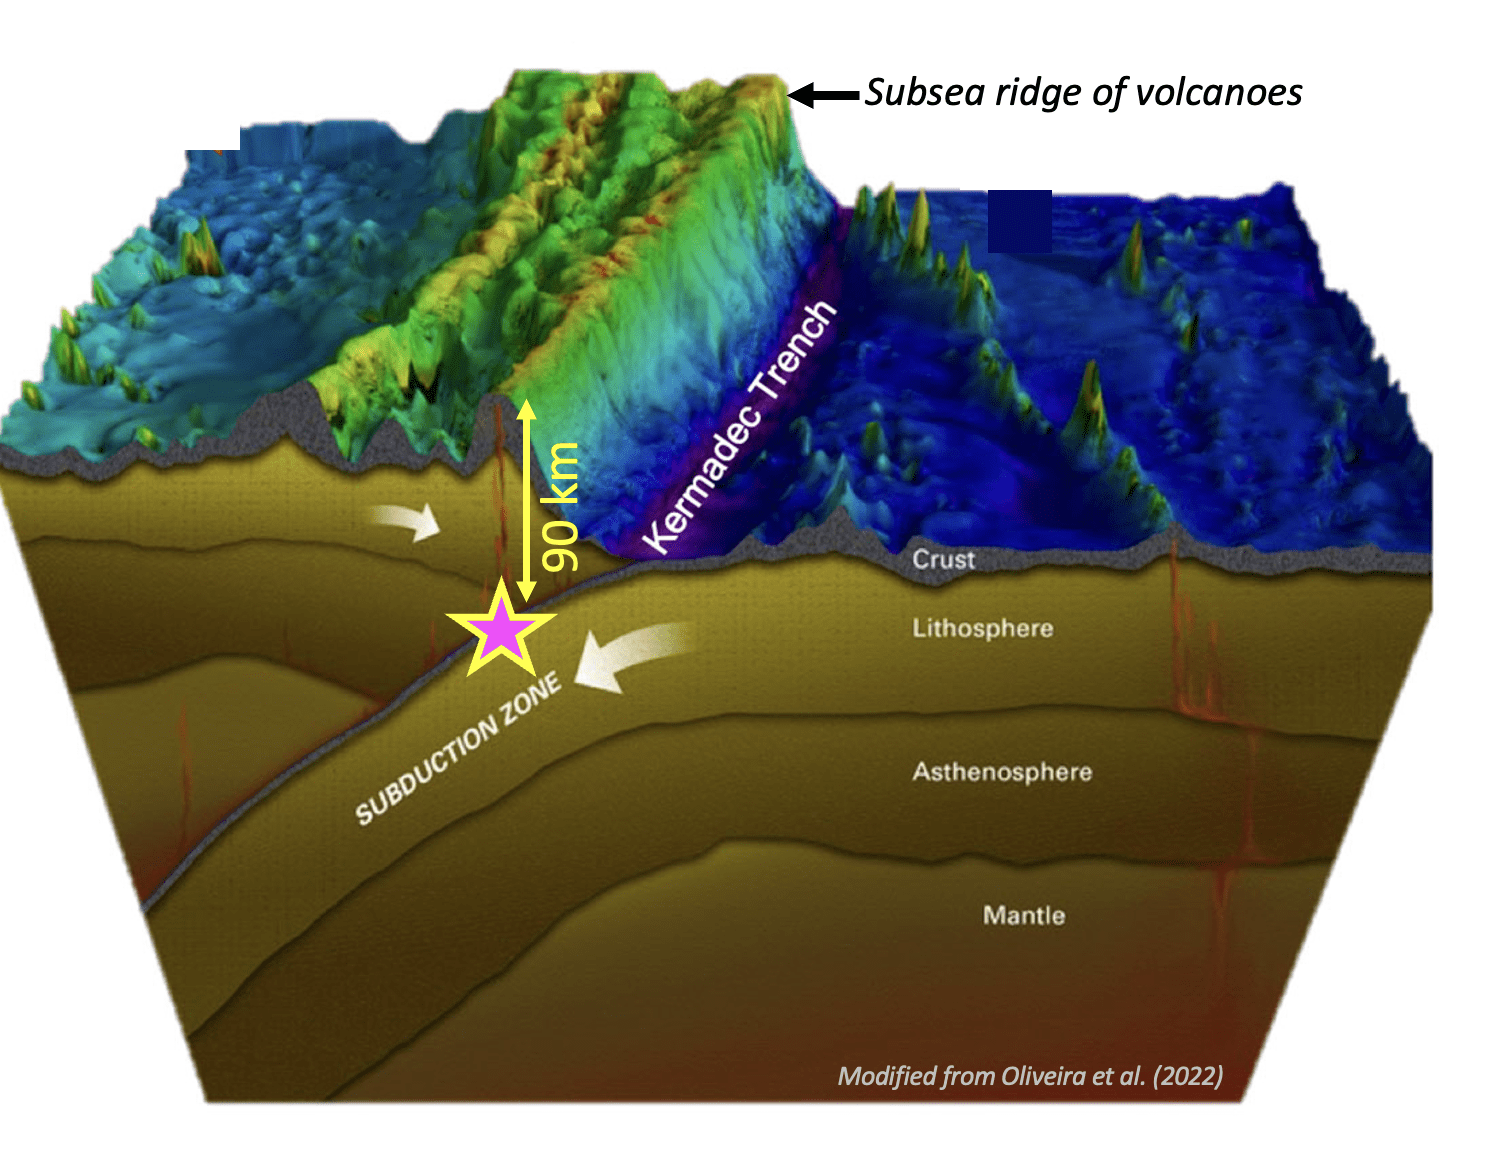
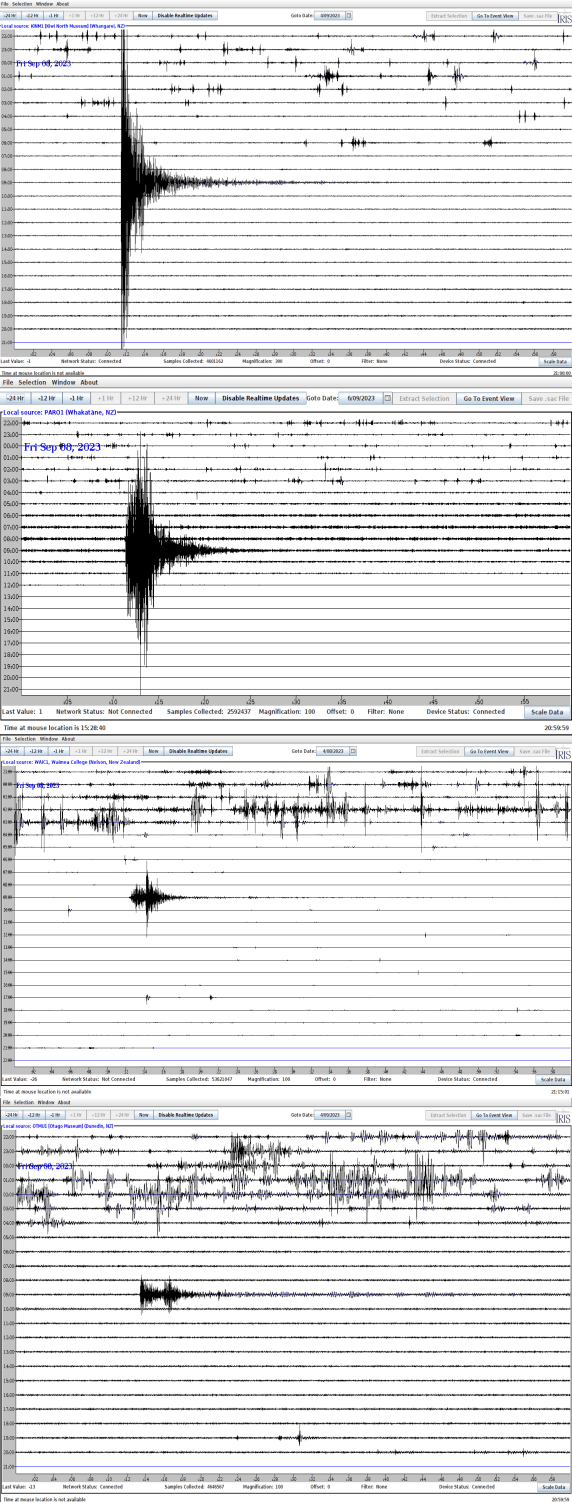
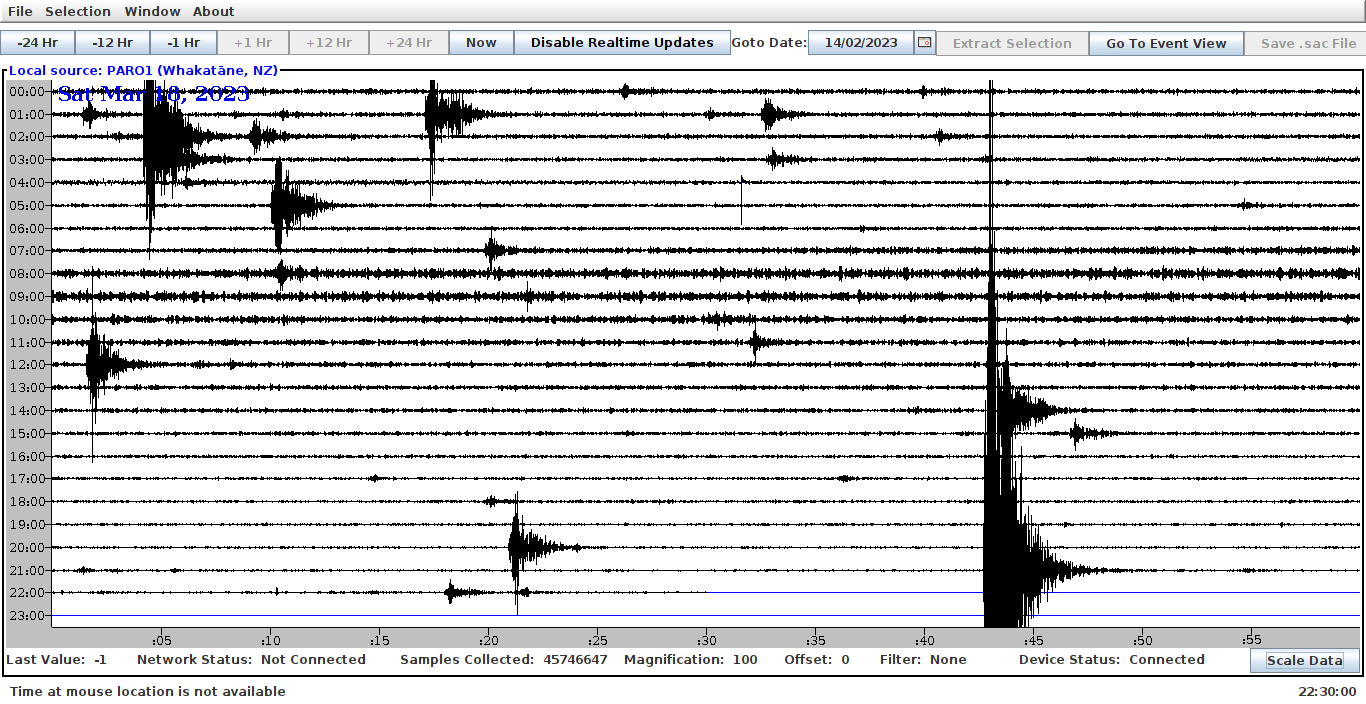
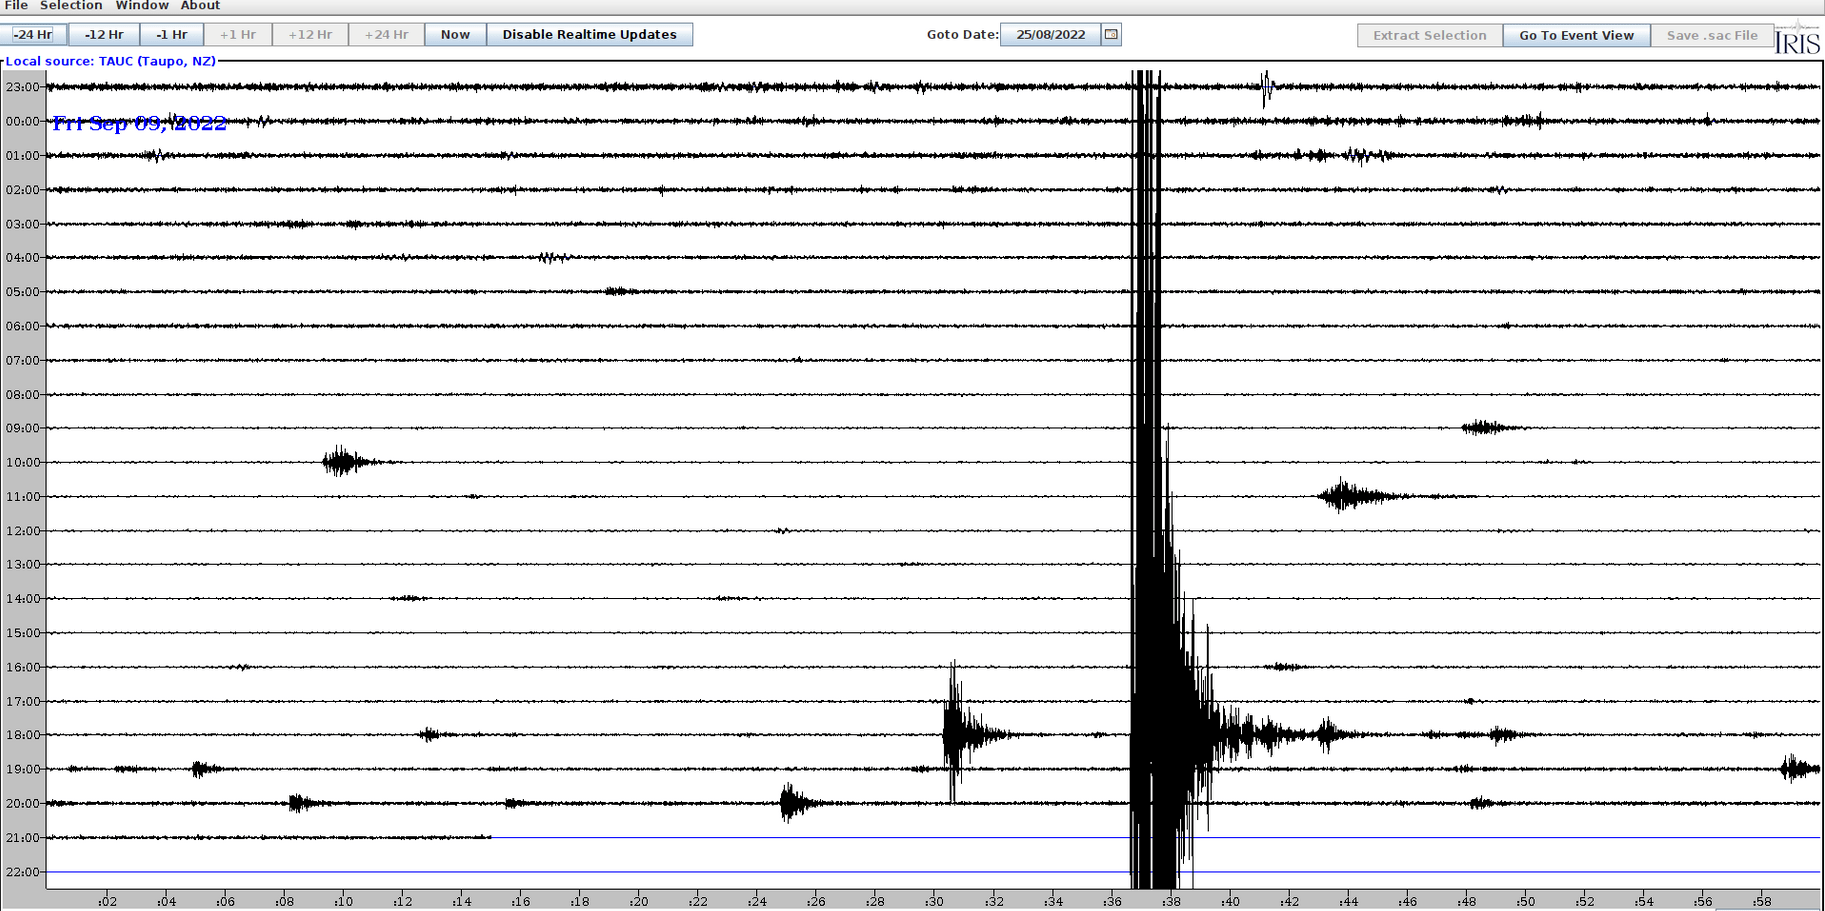
Today, a large earthquake happened near Tonga. Here, the Pacific plate subducts under the Australian plate. This earthquake was recorded on all our stations that were up and running at the time. For example, here is a snapshot of one of our newest stations MTMC1 at Mount Maunganui College: 
You can see the boundary between the Pacific and the Australian plate in the topography of the ocean floor (“bathymetry”) on google maps in the form of a darker blue colour, indicating a topographic low:

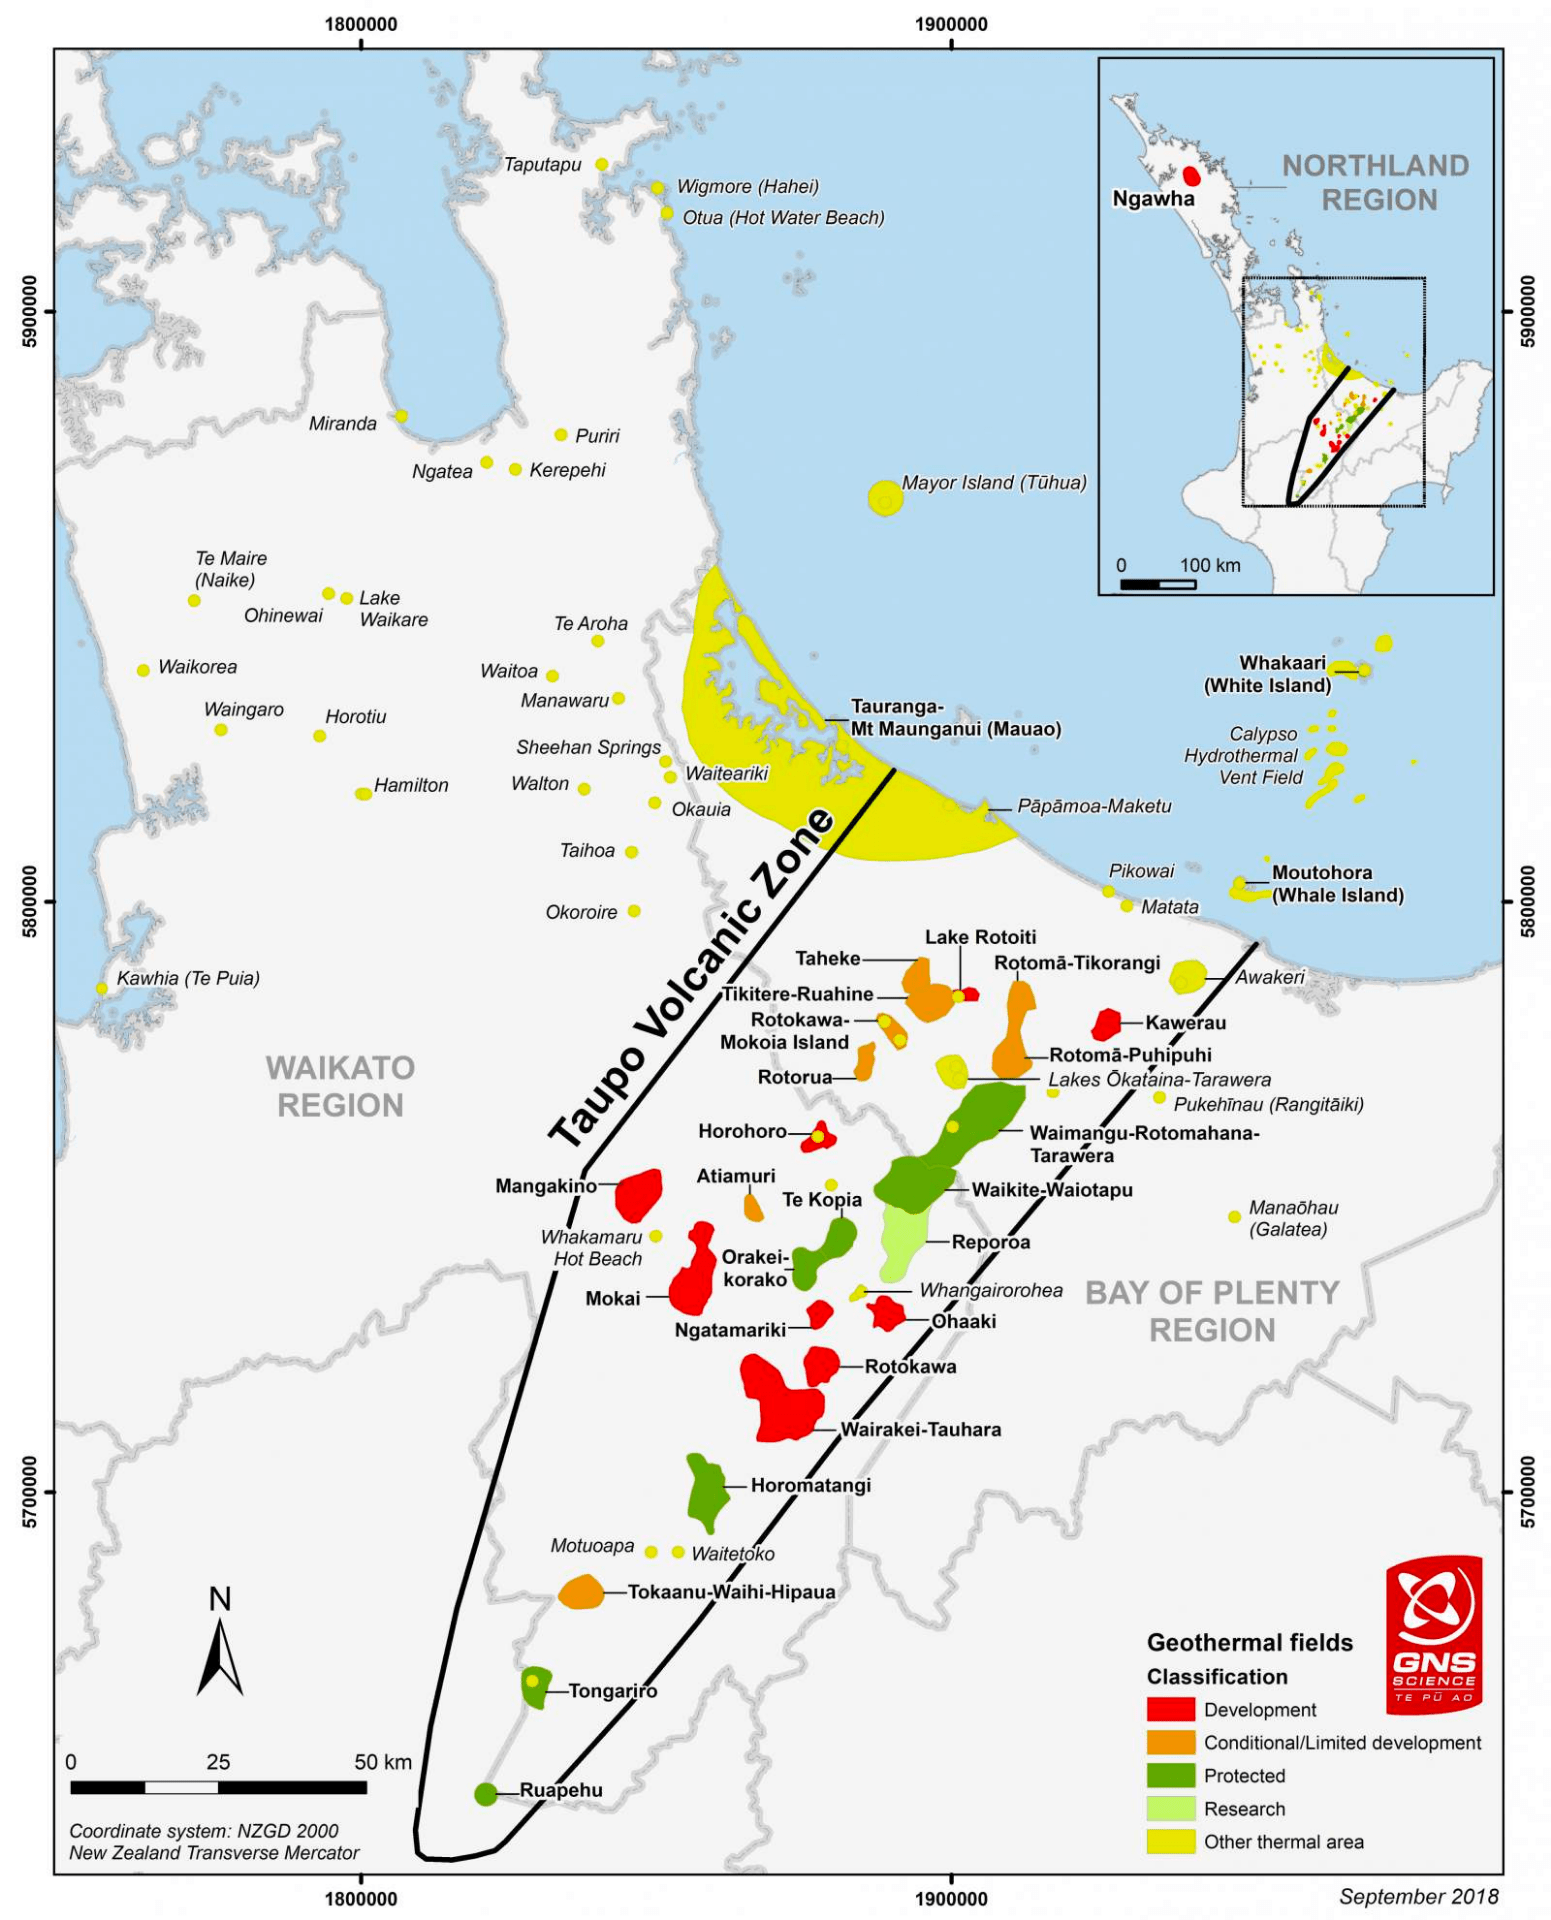
On this map, you can also observe that this subduction zone extends all the way down to New Zealand, where we have the Hikurangi subduction zone to the East of the North Island.
The big difference between the subduction off the coast of New Zealand’s North Island, Te Ika-a-Māui, and the subduction near Tonga, is the speed at which the plates converge: in Tonga, this is speed is almost twice as fast as near New Zealand, up to 24 cm per year! Unlike in Myanmar, it appears that the damage in Tonga is minimal. And while this type of earthquake can cause a tsunami, the the tsunami warning has been lifted at the time of writing.
Are these earthquakes related?
If you made it this far in reading this post, you must be really interested in earthquakes. People like you may ask if these two earthquakes are related. It does feel that when we do have large earthquakes, they come in bunches. Your feeling may not be entirely wrong. Recent studies show that the waves from large earthquakes sometimes trigger earthquakes even thousands of kilometres away. For that to happen, the fault on which the triggered earthquake happened had to be “ready to go” at any time, already. Still, it is hard or even impossible to prove that a particular earthquake is triggered by another, but there is statistical evidence it can happen!