All posts by matiu

Embedding the Rū map in a web page

See this map at http://ru.auckland.ac.nz/the-network/.

The code

Insert the following “inline” where you want the map to appear. At the time of writing, the code was still in flux, but what you see here will be a functional subset of what may be available later.

<!-- rū map -->
<div id="ru_canvas"></div>
<style type="text/css">
@import url("https://nzseis.phy.auckland.ac.nz/map/css/ru_mapem.css");
</style>
<script src="https://maps.googleapis.com/maps/api/js"></script><script src="https://nzseis.phy.auckland.ac.nz/last50/js/ru_stations.js"></script><script src="https://nzseis.phy.auckland.ac.nz/map/geonet.php?mode=js"></script><script src="https://nzseis.phy.auckland.ac.nz/map/usgs.php?mode=js"></script><script src="https://nzseis.phy.auckland.ac.nz/map/js/ru_mapfunctions.js"></script><script src="https://nzseis.phy.auckland.ac.nz/map/js/ru_legend.js"></script><script src="https://nzseis.phy.auckland.ac.nz/map/js/ru_mapinitem.js"></script><script type="text/javascript">
// <![CDATA[
var ru_options = {
"centreonstation": false,
"width": "640px",
"height": "640px",
"zoom": 5,
"iconscale": 1,
"fontscale": "100%",
"showusgs": true,
"showgeonet": true,
"showlegend": true,
"lat": -41.0,
"lon": 174.0,
"canvas": document.getElementById('ru_canvas'),
};
RU_ICON_SCALE = ru_options.iconscale;
RU_FONT_SCALE = ru_options.fontscale;
google.maps.event.addDomListener(window, 'load', ru_initialize());
// ]]>
</script>
<!-- /rū map -->

A number of parameters can be configured to change the way the map is displayed -these are wrapped up in a javascript object (ru_options).

The paramaters

centreonstation
false or the short name of a station in the Rū family. If false, then the map will centre on the latitude and longitude specified using “lat” and “lon”. If a station is specified, then the map will centre on the latitude and longitude recorded for that station.

width and height
String literals that are assigned to the respective style properties of the map canvas. You could specify a dimension in pixels, a percentage, or whatever units CSS allows. The posts associated with stations in this web site, use “474px” for height and width.
“100%” (with appropriate styling of the canvas element) could be used to fill a viewport.

zoom
An integer between 1 and 20, representing the zoom steps the Google Maps API allows. 5 or 6 is good for a view of the whole of New Zealand, 17 is good for a view of a building in its context.

iconscale
A positive and non-zero decimal value used to vary the scale of the icons used as map markers. All markers are scaled by this value which can be used to make the map more legible at different sizes.

fontscale
A string literal added as a font-size style property to the legend (if it is visible). This can be used to adjust how the legend looks at different sizes.

showusgs, showgeonet and showlegend
True or false. These give you control of the visibility of the various information layers available.

lat and lon
A Latitude and longitude that will be used to centre the map if centreonstation is false. The default provided is near the centre of New Zealand (-41.0, 174.0).

canvas
Used to pass the element used as the map canvas to the initialisation function -if you name the container differently (ie. not ru_canvas), then change the id inside the getElementById expression.


jAmaseis upgrade 1.02.0

An update for the SeisNZ fleet!

Released August 2014, this upgrade is to be installed on the machines connected to the seismometers.

If your version of jAmaseis needs updating, you will see an alert titled “Incompatible Version“. The text below the title will say something about needing to upgrade to version 1.0.2.x to be compatible with the IRIS data collection server. This incompatibility does not affect our ability to upload the screen grabs -just the way in which the instrumentation data is pushed to IRIS -given we are not yet doing this in any concerted fashion, this update is not essential.

The following is a recording of the process:

Step by Step

Quit jAmaseis and log out

Log in using the Seismometer Admin[istrator] account.

Open a finder window, and browse to the data hard drive.

Open this, then open the data folder, then open Shared

You should see a file labelled jAmaseis1020_install.app.zip

Copy this to the desktop.

Double click to unzip the file.

Double click on the extracted application jAmaseis_install[.app]

You should be able to click through the various dialogues without changing anything, but double check the settings if you like -the application needs to be installed in the Applications folder on the system drive (this will normally be named nzseis-XXX).

Once finished, check that the “Prevent Appnap” setting is checked, and restart the computer.

This should eventually bring the jAmaseis application back in the Seismometer User account -the new version should be up and running!

In the video above, I check the “Prevent Appnap” settings -but it looks as though the upgrade does not affect this.

DIY

You need to log in as the Seismometer Admin user.

Make sure jAmaseis is not already running.

Download the software from http://www.iris.edu/hq/jamaseis/.

Double click to install, and use the defaults provided.


createkml.py

createkml.py

A python script that creates a kml representation of earthquake data.

createkml.py expects a path to a csv file of the form created by the Geonet csv export call.

The implementation I use to do this reads the file downloaded by a bash script (running as a cron job)

The essential part of this is

wget -O /PATH/TO/FILE.csv "http://wfs.geonet.org.nz/geonet/ows?service=WFS&amp;version=1.0.0&amp;request=GetFeature&amp;typeName=geonet:quake_search_v1&amp;maxFeatures=50&amp;outputFormat=csv"

The format of the file has the following columns, we are only interested in a few of them (in bold)

FID,
publicid,
eventtype,
origintime,
modificationtime,
latitude,
longitude,
depth,
magnitude,
evaluationmethod,
evaluationstatus,
evaluationmode,
earthmodel,
depthtype,
originerror,
usedphasecount,
usedstationcount,
minimumdistance,
azimuthalgap,
magnitudetype,
magnitudeuncertainty,
magnitudestationcount,
origin_geom

See http://info.geonet.org.nz/

The code

Basic stuff, no data integrity checking (this is part of a pipeline in the local implementation).

#!/usr/bin/python

import argparse
import StringIO
import csv
import datetime
import dateutil.parser
import math

#  build the parser
parser = argparse.ArgumentParser(description='Plot earthquakes on a map')
parser.add_argument('filename', help='path/to/csv file')
args = parser.parse_args()

#  open the file provided
f = open(args.filename, 'r')

#  read it in, and create the basic data we will
#  be using
output = StringIO.StringIO(f.read())

#  import in csv file format
data = csv.reader(output)

#   drop the first line
data.next()

#  print out the top of the file
print '<!--?xml version="1.0" encoding="UTF-8"?-->\n\n'
print '\tRecent earthquakes in and around New Zealand'
print '\tSource: GeoNet (www.geonet.org.nz); Created: {}'.format(repr(datetime.datetime.now().isoformat()))

# get the time right noe (UTC)
now = datetime.datetime.utcnow()

# maxdepth is the deepest value
# after which all colour values are clamped

maxdepth = 400.0

for row in data:
  # convert the date to something humans understand
  whendatetime = dateutil.parser.parse(row[3])

  # figure out how far to fade the icon
  # clamp this to ~25% minimum
  difference = (now - whendatetime).total_seconds();
  if difference &gt; 86400:
    difference = 86400
  elif difference &lt; 0:
	difference = 0

  # 'shade' is a two character hex value, 3f-ff,
  # used as the alpha value in the colour applied
  # to the icon
  shade = format(255 - int((float(difference)/86400)* 192),'02x')

  # Generate a colour value for the icon
  # associated with depth.
  # The color ramp will be a logarithmic
  # progression from 00ff00 (shallow)
  # to 0000ff (deep), maxed at maxdepth km?
  depth = float(row[7])

  # fast at shallow, slow at depth
  # multiplier = 255/sqrt(maxdepth)
  # depth2 = math.sqrt(depth)*(255/math.sqrt(maxdepth))

  # slow at shallow, fast at depth
  # divisor = maxdepth/sqrt(255)
  # depth2 = (depth/(maxdepth/math.sqrt(255)))**2

  # flat
  # multiplier = maxdepth/255
  depth2 = depth*(255/maxdepth)

  if depth2 &gt; 255:
    depth2 = 255.0
  elif depth2 &lt; 0:
    depth2 = 0.0
  if depth2 &lt; 128:
    green = 'ff'
    red = format(int(depth2*2),'02x')
  else:
    green = format(255-int((depth2-128)*2),'02x')
    red = 'ff'

  # round magnitude to determine the icon style
  magnitude = float(row[8]);
  magnitudelow = int(math.floor(magnitude))
  if magnitudelow &gt; 9:
    magnitudelow = 9
  elif magnitudelow &lt; 0:
    magnitudelow = 0

  description = '<![CDATA[\n
<div style="text-align: left;">'
  description += '<a href="http://www.geonet.org.nz/quakes/region/newzealand/' + row[1] + '" target="' + row[1] + '"><b>' + row[1] + '</b></a>'
  description += '\n
<b>' + whendatetime.strftime('%H:%M, %d %B %Y') + '</b> (UTC)'
  description += '\n
magnitude: <b>' + str(round(float(row[8]),2)) + '</b>'
  description += '\n
depth: <b>' + str(round(float(row[7]),2)) + 'km</b>'
  description += '</div>
]]>'

  print '\t'
  print '\t\t' + description + ''
  print '\t\t' print '\t\t\n\t\t\t' + row[6] + ',' + row[5] + ',0' print '\t\t\n\t' # print out the bottom of the file print '\n\n'

The script dumps its output to standard output, so I generally redirect this to a file.

Setting up a source in jAmaseis

The TC-1

Our TC-1 came as a kit
tc-1-02-made
and was very easy to complete

Location

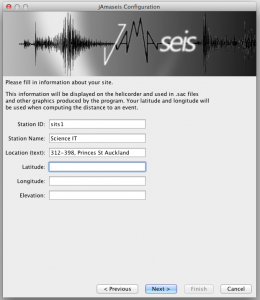
There are a couple of ways of getting good location information suitable for configuring jAmaseis. The software needs a longitude, latitude and altitude value. Where these are accurately known on a number of stations, it is easier to calculate good magnitude and depth values for events observed on multiple stations.

How accurate should it be? At the latitude of the example discussed in this article, each degree East or West is ~90km (at the equator, a degree is ~111km), so the 4 decimal places used below suggests an accuracy of ~0.010m for longitude. Latitude is similar.

iPhone (or similar)

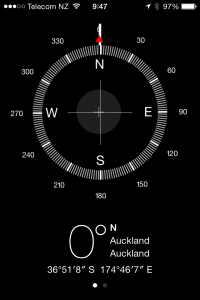
Assuming you are close to or on the point where the TC-1 will be deployed, your GPS enabled phone/pad/computer can give you suitable coordinates.

The compass provides longitude and latitude

jAmaseis wants decimal values for longitude and latitude, so you need to do a bit of maths. Latitude is how far up (+) or down (-) you are on the arc  joining the North pole (90ºN or 90º) to the South pole (90ºS or -90º) running though your location. In the example above, my latitude is 36º51’8”S (degrees, minutes, seconds South), which can be converted to

36 + 51/60 + 8/(60*60) x -1 ≈ -35.8522
(the -1 is due to the S)

Longitude is how far East (+) or West (-) around the Earth you are on a circle parallel to the equator (where all points on the circle share the same latitude) where 0 is the intersection of the arc running between the North and South poles intersecting the Royal Observatory at Greenwich. In the example above, my longitude is 174º46’7”E (degrees, minutes, seconds East), which can be converted to

174 + 46/60 + 7/(60 x 60) ≈ 174.7686

Google Maps

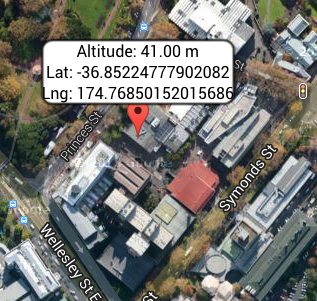
If you know here your seismometer is, then you can use Google maps. Centre the map above your target location and copy the longitude and latitude from address bar.

If your machine has the capability, Google Maps can use location services to centre the map.

Altitude

Try http://www.altitude.nu

FindAltitude
A Google Maps like interface allows you to locate and find an altitude!

jAmaseis

When you plug your seismometer in, your computer may ask about a new network or communications device -ignore it (close it, whatever)

The port you use is important -if you change it, you may need to reconfigure the source (so jAmaseis can find it again).  On the Macs we are deploying, we will typically use the USB port closest to the power socket. The TC-1 needs power, so it is best not to use one of the ports on a keyboard (if you have such a keyboard).

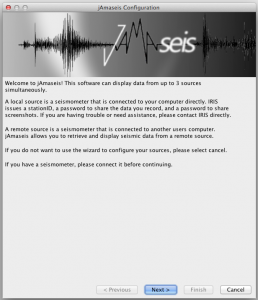
Assuming jAmaseis is already installed, you can run the Source configuration wizard from the File menu.

jam-01-addsource

next...
next…
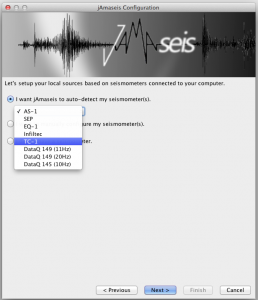
Choose the appropriate seismometer type and model
Choose the device...
Choose the device…
Fill in the details
Fill in the details

Sort out your location (see above)

Fill in the longitude and latitude
Fill in the longitude and latitude … Next …
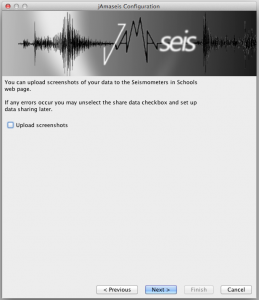
Untick for now
Untick for now
ditto -we will put this back later
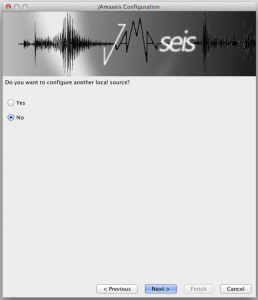
Not right now thanks...
Not right now thanks…
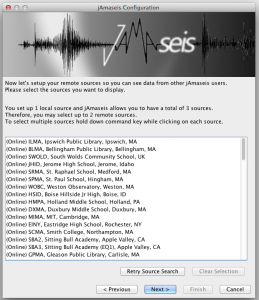
Up to you, but these can be confusing when you're setting up...
Up to you, but these can be confusing when you’re setting up…
I did not have data from another machine, so stepped past this -use at your discretion
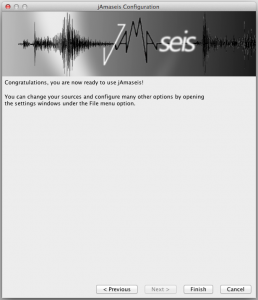
Done!
Done!

Screen shots

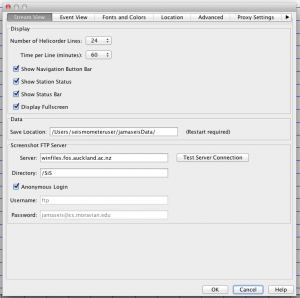
Let’s change the FTP target … The settings dialogue accessed through the file menu, offers places to configure this.

Configure upload settings, etc

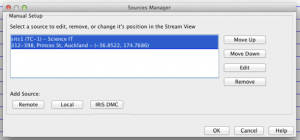
To switch upload back on, select Manage sources from the  File menu.

Manage sources
Manage sources
Automatically send screenshots to FTP server
Up and running...
Up and running…


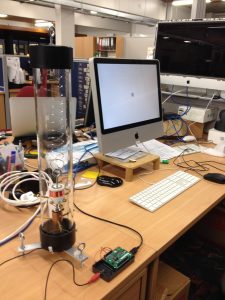
iMac + tc-1

iMac+TC-1
TC-1 on the left, connected through an Arduino and amplifier to the iMac

hardware

  • 21″ iMac, c2008 model
  • 3GB RAM
  • 320GB HDD (divided into system and data partitions)

software environment

  • MacOS X 10.9.x
  • ESET NOD32 – antivirus
  • Casper client – platform management
  • Current JRE 7, JRE 6 (Arduino)
  • jAmaseis
  • Arduino IDE/drivers
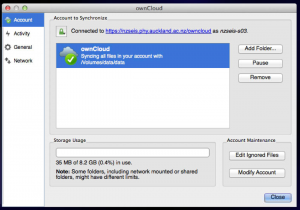
  • Owncloud desktop client – synchronization/backup
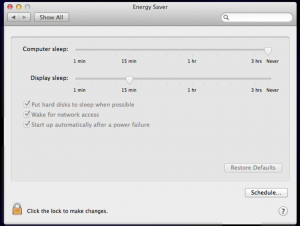
  • Energy Saver
    energy saverT

    he energy saver settings are applied to the iMac using a policy in our Mac management tool, Casper (not to be confused with Kasper!). Even if these settings are modified by a local administrator, they will revert to those shown above when Casper refreshes the policy on the machine -if a School using one of these,needs us to modify the settings, we can unlock the policy  -let Kasper know.

(italicised items are specific components of the University platform being used here and NOT requirements for the basic seismograph)

user configuration

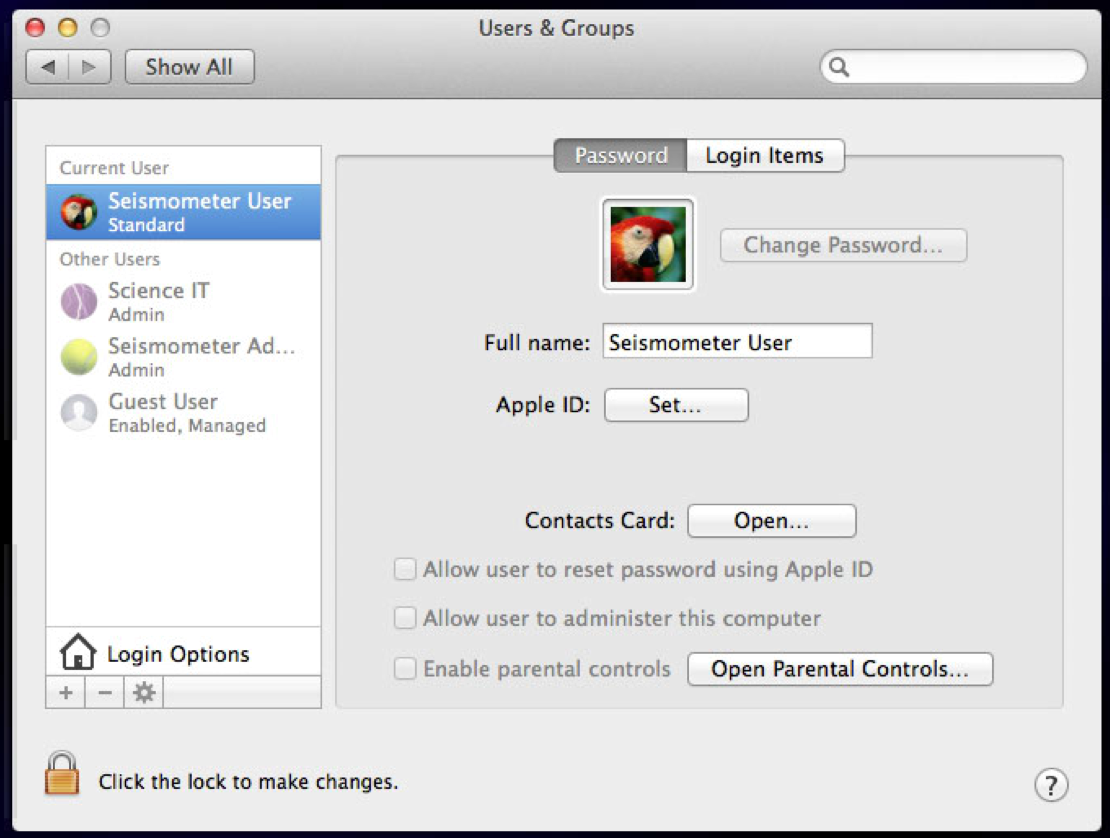
Users

  • scienceit
    Standard administrative user account used to manage Macs in Science at the University of Auckland. Used for remote management, updates, etc.
  • seismometeradmin
    An administrative account for the project participants -used to install and upgrade the software specific to the project.
  • seismometeruser
    The workhorse account. A standard user.

seismometeruser environment

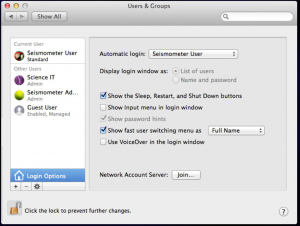
  • Automatic log in
    automatic login
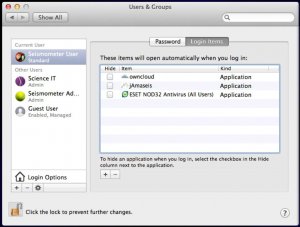
  • Login items
    login items
  • Dock
    Dock
  • Owncloud
    Owncloud settings
    configure Owncloud to synchronize /Volumes/data/data
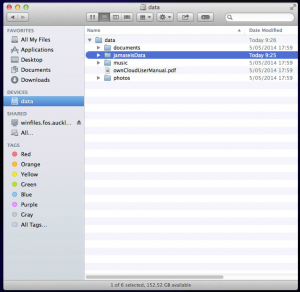
  • /Volumes/data/data
    data on data
  • /Users/seismometeruser
    ~seismometeruser
    ln -s /Volumes/data/data/jamaseisData /Users/seismometeruser/jamaseisData

jAmaseis configuration

Prevent App Nap
prevent appnap

Set up local seismometer source (see configuring the TC-1).

Configure screenshot uploads
jAmaseis settings

Platform instances

[catlist tags=imac-tc1 post_status=any post_type=post excludeposts=this]