Category Archives: news

M8.8 Kamchatka Peninsula Earthquake

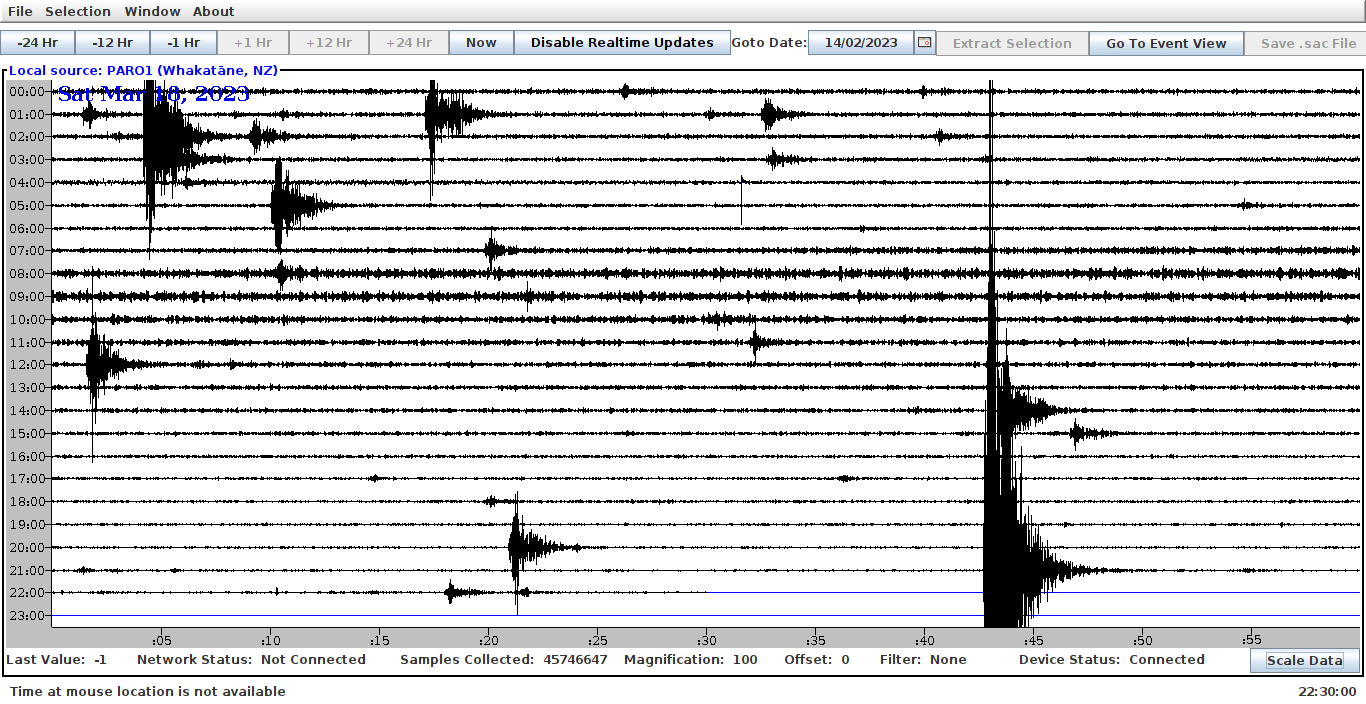
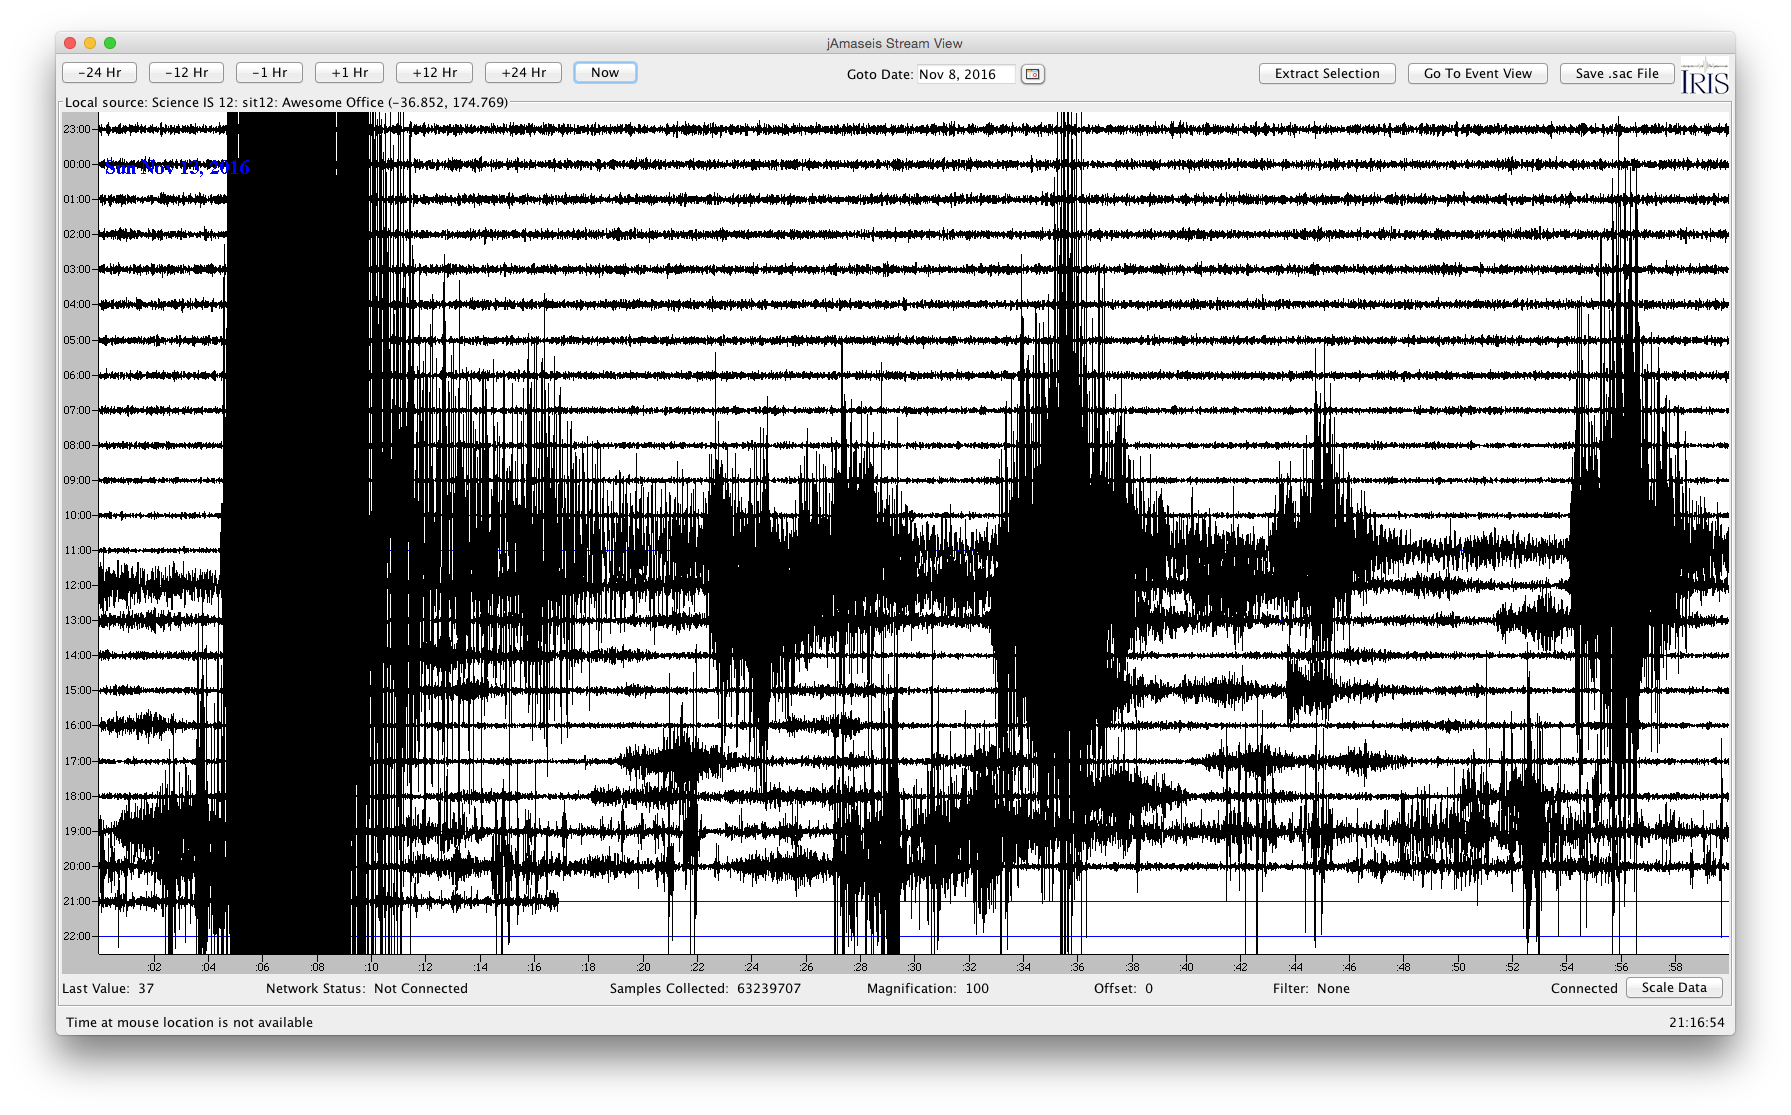
On July the 29th (UTC), but the 30th of July local time in New Zealand, there was a magnitude 8.8 earthquake in North Eastern Russia. In our network we did not record clear primary or secondary seismic waves, because this earthquake is  in the shadow zone for body waves for most of our network.  We did record some very interesting long-period waves. In the image below from Taupo-nui-a-Tia College, we can see long-period signals from before midnight to 3am, UTC. These are the result of the Earth ringing like a bell after such a big earthquake. (After all the ringing stopped, you can see a clear recording of a small earthquake in  the subducted tectonic plate 100km under Taupō,)

In addition to seismic waves, this earthquake generated a tsunami as it lifted the ocean floor, pushing water up too. You may have gotten a few alarms about this tsunami on your phone today!

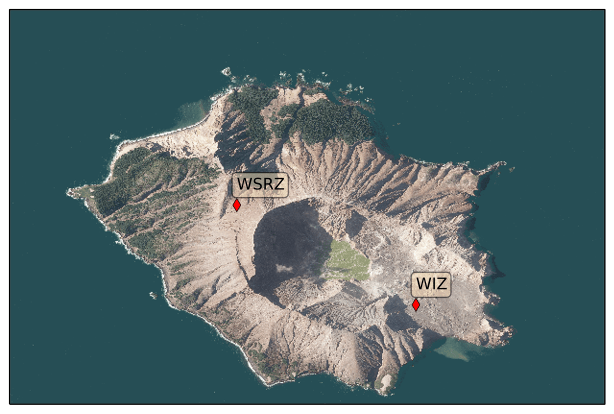
The tsunami travels much slower than the seismic waves, and arrived only this morning here in Aotearoa. I have downloaded data from buoys around New Zealand that measure the water depth. These data are recorded at the blue triangles, and freely available thanks to Geonet:

In the figure below, you can see the water depth for the last 2 days. Around 2am local time this morning, you can see the tsunami waves changing the water depth up and down in periods of 30 minutes to an hour. These waves are still arriving or sloshing around at the end of this recording, 10pm local time:

Auckland is the top station, and Wellington is at the bottom. The scale on the y-axis may be hard to read, and it varies from station to station, but the tsunami waves are up to a few 10s of centimeters. Locally in New Zealand these tsunami waves could have constructively interfered to higher values.

The first station to record the tsunami on this network was RFRT on Raoul Island. If we sort the data from closest to Russia to farthest, you can see the tsunami’s propagation across the network:

If you want to learn more about tsunamis and how they affect us out here in the South Pacific, I encourage you to visit the RCET webpage. RCET is programme to improve our response to threats from Earthquakes and Tsunami.

A tale of two earthquakes

In the last two days, we had two very large earthquakes. In Myanmar, a magnitude 7.7 earthquake caused devastation, not only in Myanmar, but also in the region. The vast majority of earthquakes happen on plate boundaries, and this event was no exception.  At the largest scale, the cause of earthquakes in the region is the collision between the Indian and Eurasian plates,. This is the same collision that is responsible for the Himalaya’s to the Northwest.

Today, a large earthquake happened near Tonga. Here, the Pacific plate subducts under the Australian plate. This earthquake was recorded on all our stations that were up and running at the time. For example, here is a snapshot of one of our newest stations MTMC1 at Mount Maunganui College:

You can see the boundary between the Pacific and the Australian plate in the topography of the ocean floor  (“bathymetry”) on google maps in the form of a darker blue colour, indicating a topographic low:

On this map, you can also observe that this subduction zone extends all the way down to New Zealand, where we have the Hikurangi subduction zone to the East of the North Island.

The big difference between the subduction off the coast of New Zealand’s North Island, Te Ika-a-Māui, and the subduction near Tonga, is the speed at which the plates converge: in Tonga, this is speed is almost twice as fast as near New Zealand, up to 24 cm per year! Unlike in Myanmar, it appears that the damage in Tonga is minimal. And while this type of earthquake can cause a tsunami, the the tsunami warning has been lifted at the time of writing.

Are these earthquakes related?

If you made it this far in reading this post, you must be really interested in earthquakes. People like you may ask if these two earthquakes are related. It does feel that when we do have large earthquakes, they come in bunches.  Your feeling may not be entirely wrong. Recent studies show that the waves from large earthquakes sometimes trigger earthquakes even thousands of kilometres away. For that to happen, the fault on which the triggered earthquake happened had to be “ready to go” at any time, already. Still, it is hard or even impossible to prove that a particular earthquake is triggered by another, but there is statistical evidence it can happen!


Earthquake swarm in Bay of Plenty

In the last two days the Bay of Plenty has been shaken by hundreds of earthquakes, some greater than magnitude 4, and most of them relatively shallow (less than 15km) . This means shaking at the surface has been significant, but we have not read of any people getting hurt, thankfully. Our whānau at Te Kura O Te Pārao are less than 20km from the middle of this swarm, and the evidence on their station is clear:

The region has been at the mercy of Tāwhirimātea *and* Rūaumoko in recent months an our thoughts are with those enduring the shaking while recovering from the recent storms.

This particular swarm appears to happen very near the natural geothermal area of Awakeri, which is part of the surface expressions of the Taupō Volcanic zone (TVZ).  Below is an image from the geothermal website of nz that shows the geothermal areas of the TVZ, including Awakeri:

Geothermal fields of the Taupō Volcanic Zone, courtesy of the New Zealand Geothermal Association and GNS Science.


The Seismic Sound of Silence in Level 4 Locked-down Aotearoa

The COVID-19 pandemic is paralyzing our ways of life, as we are hunkered down in a Level 4 lock-down. Businesses are closed, and work is moved to home, where possible. Schools are closed, and we live in our “bubbles.” Many of the seismic stations in the Ru network of school seismometers continue to operate, however, and we wanted to share with you some interesting observations. Here is a figure from our station at St. Mary’s Catholic Primary School in Rotorua:

The horizontal scale starts on January 1st of this year, and ends today, April 9th. The vertical scale is the average noise level at the station. There is a lot to see in here. First, the smallest consistent variations are between the days and the nights; Rotorua and St. Mary’s Primary School are much quieter during the nights than during the days. The next scale up, you can see that every 7 days, there is a period of low noise. These are the weekends, which are generally quieter than the weekdays. At an even larger time scale, we see that St. Mary’s  station was less noisy during the Summer Holiday than during term 1 of school. Until two weeks ago, when school closed again, and noise levels dropped to its lowest levels.

This shows that seismometers are sensitive to the noise we humans make, even the not fully grown ones. In this case, the exceptionally low noise levels during the lock-down, lower than the Summer Holiday levels, indicate that station SMC2 is (normally) sensitive to human noise beyond the classroom, such as cars driving in the street. If you don’t believe us, please read the GEONET news, where it is reported that the lock-down in Auckland can be sensed all the way in a borehole 300 m under ground!


Seismic data from the Whakaari (White Island) eruption of December 9th, 2019

Yesterday, an eruption on Whakaari led to injuries and loss of lives. Our thoughts are with the whanau of those affected by this tragic event. We have been getting a lot of inquiries about this eruption, so we decided to write up what we know about the seismology associated with this eruption.

Whakaari is a volcano that is part of the Taupo Volcanic Zone, and forms a small island in the Bay of Plenty.

As far as we can tell, none of the Ru stations recorded the signals associated with the eruption, but GEONET operates seismic stations on the island:

The seismic data for station WIZ are plotted below. We annotated the time of the eruption. You can see that in the day(s) leading up to this, there were some small spikes in the data indicative of small local earthquakes. In addition, we can see a few hours of low-amplitude “rumbling” of Whakaari on the 8th of December:

Seismic station WSRZ is closer to the top rim of the volcano, and recorded this:

It looks like the amplitudes of the seismic signals were elevated  on the 7th and 8th of December, but things actually calmed down on the 8th before the eruption…  After the eruption, small impulsive signals may be from brittle failure of the rocks (small earthquakes).

It is difficult — if not impossible — to predict volcanic eruptions, and even after the fact it is hard for us to say whether signals prior to the eruption were out of the ordinary for Whakaari. The experts at GNS have had a elevated warning in place for Whakaari since October, based on seismic signals such as these, and gas sensing. In addition, an M5.9 earthquake at 115 km depth occurred on November 24th with its epicentre about 10km from Whakaari. As with all geological tragedies such as these, we hope we can learn more about the rumblings of Rūaumoku, reducing risk in future calamities.


Ru in the news

In recent months we have added many new schools to our network, including Maungatapu Primary School. Under direction of Chris Dixon, this school is very active in the sciences. Through the Ru network, it is able to also connect its Maori language immersion programme, for example; have a look at their “Ru Whenua” posters!

All their hard work has attracted the attention of local media, resulting in this great article about their recordings of a local swarm of earthquakes. Well done, Edward, Jackson, Jamie, and all the others at Maungatapu School!


Severe earthquake NNE of Amberley, NZ

Birkenhead
This is a screenshot of the seismic recordings at Birkenhead Primary School, on November 13th, 2016.

Shortly after midnight, last night, a severe earthquake struck the South Island. The full extent of the damage is not clear yet, and of course the members of the Ru network think about those affected by this event.

The seismic networks computed the thrust motion on the fault in a matter of minutes, and in this case the motion on the fault warranted a tsunami warning.

The New Zealand Herald features an article with the first reactions from geonet scientists. The mention of the Hope Fault is interesting. This fault is the southern-most fault of the Marlborough Faults (as far as we know!), which extend from the Alpine Fault. However, both Geonet and the USGS indicate a more southern placement of the epicentre. Besides, the Hope Fault is a strike-slip fault, whereas this event was a thrust fault! We at Ru wouldn’t be surprised if this event was slip (or slips, plural) on a combination of faults. In any case, there will much to learn from this event in the coming time. A discussion about the complexity of the tectonics in this area has already been posted on the USGS website.

Meanwhile, you can expect hundreds of aftershocks to fill your station helicorder screens in the coming days and weeks. If you get this message on Monday November 14th (local New Zealand time), you can see much of the action on our network page, similar to the image at the top of this post from Birkenhead Primary School.

.

James Hargest College and Koranui School Join the Network and Ru in the Southland Times

Last week we welcomed James Hargest College, Invercargill and Koraunui School, Lower Hutt to the Ru Network. James visited the schools to help with set-up and run some Earthquake location demos with students. We were met in Invercargill by a reporter for an article in the Southland Times.

20160817_090418

20160817_094917

Some photos from the day at Koraunui.

Thanks to all the students and teachers at both schools. We hope you enjoy using the seismometer to explore the Earth!