We are very proud to announce that our team now includes Dan Hikuroa from Nga Pae o te Maramatanga, New Zealand’s Indigenous Centre of Research Excellence. There are several projects around the globe that do seismology in schools, but to celebrate New Zealand’s unique cultural heritage and its natural expressions such as earthquakes and volcanoes, we decided to name our network “Ru”, short for Ruaumoko, The Maori God of Earthquakes and Volcanoes.
Category Archives: information
posts tagged with the “information” title, involve any info related to the workings of the TC1, including setting it up, and troubleshooting problems.
Rū

Mātauranga Māori (Māori knowledge) – produced over a time span of 1000 years, offers the longest record of New Zealand earthquakes available.
The name Rū is the Māori word for earthquakes, itself derived from Rūaumoko the deity of earthquakes (also known as Whakaruaimoko, Rūamoko, Rūaimoko, Whakarūamoko, Rūaimokoroa).
In Māori tradition, earthquakes are caused by Rūaumoko, the son of Ranginui (the Sky-father) and his wife Papatūānuku (the Earth-mother). Rangi had been separated from Papa by one of their sons Tānenuiarangi, and because they pined for one another so much, producing clouds, rain, mist, frost and snow, their sons resolved to turn their mother face downwards, away from Rangi towards Rarohenga, the underworld. When Papatūānuku was turned over Rūaumoko was still at her breast and was carried to the world below where he was given fire – te ahi komau to provide warmth and comfort for his mother. To avenge the ill-treatment of his parents, Rūaumoko constantly battles humankind, physically manifested by earthquakes and volcanoes. Although a geological interpretation of the ultimate explanations of why we experience earthquakes and volcanoes differs fundamentally from that given above, some interesting commonalities exist, most notably that earthquakes and volcanoes are caused by the same processes – heat causing earthquakes and volcanoes.
jAmaseis upgrade 1.02.0
An update for the SeisNZ fleet!
Released August 2014, this upgrade is to be installed on the machines connected to the seismometers.
If your version of jAmaseis needs updating, you will see an alert titled “Incompatible Version“. The text below the title will say something about needing to upgrade to version 1.0.2.x to be compatible with the IRIS data collection server. This incompatibility does not affect our ability to upload the screen grabs -just the way in which the instrumentation data is pushed to IRIS -given we are not yet doing this in any concerted fashion, this update is not essential.
The following is a recording of the process:
Step by Step
Quit jAmaseis and log out
Log in using the Seismometer Admin[istrator] account.
Open a finder window, and browse to the data hard drive.
Open this, then open the data folder, then open Shared
You should see a file labelled jAmaseis1020_install.app.zip
Copy this to the desktop.
Double click to unzip the file.
Double click on the extracted application jAmaseis_install[.app]
You should be able to click through the various dialogues without changing anything, but double check the settings if you like -the application needs to be installed in the Applications folder on the system drive (this will normally be named nzseis-XXX).
Once finished, check that the “Prevent Appnap” setting is checked, and restart the computer.
This should eventually bring the jAmaseis application back in the Seismometer User account -the new version should be up and running!
In the video above, I check the “Prevent Appnap” settings -but it looks as though the upgrade does not affect this.
DIY
You need to log in as the Seismometer Admin user.
Make sure jAmaseis is not already running.
Download the software from http://www.iris.edu/hq/jamaseis/.
Double click to install, and use the defaults provided.
You see a blip on the screen. Now what?
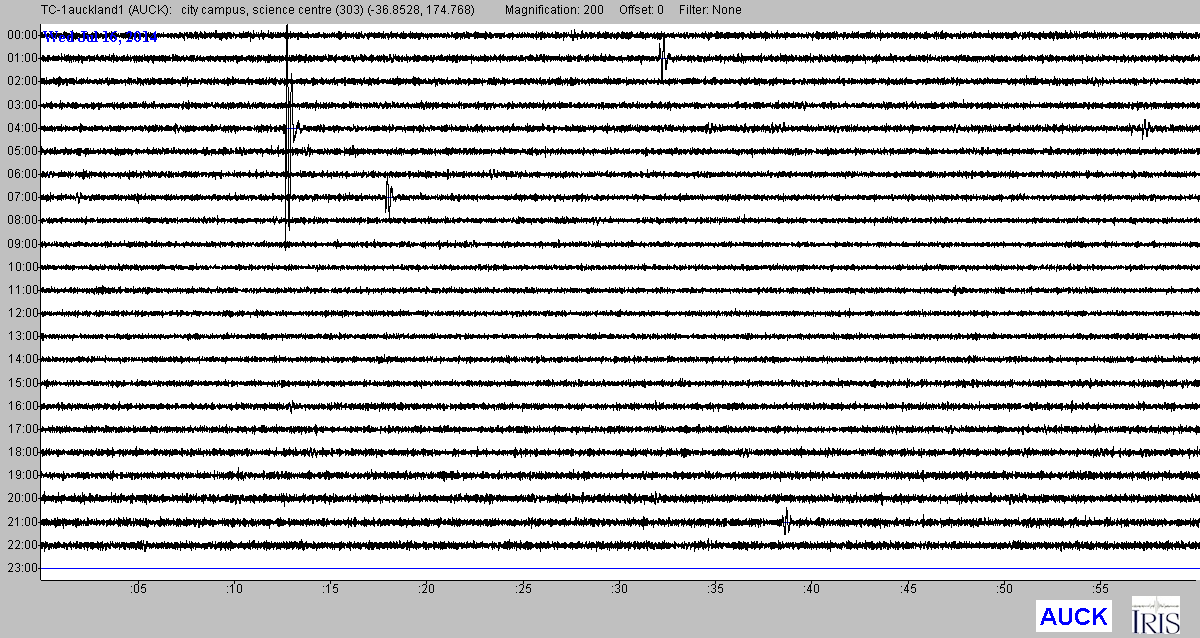
More often than not, the screen of your seismic stations may look something like this:
Overall, the wiggles are small. The few spikes in this case are probably due to some electronic interference in the area where station AUCK is housed.
BUT: If you see something on your seismometer screen that stands out from the rest of your recordings, like this:
Then, there are a number of things you can check to see if you recorded an earthquake (or if this was some noise generated by bumping into the sensor, for example).
Geonet
Geonet is “the official source of geological hazard information for New Zealand,” according to the site. They run a large network of seismometers in New Zealand, whose data is the source of information about all recorded earthquakes in New Zealand. Can you find an earthquake that would arrive at your school at the time of your signal?
USGS
The United States Geological Survey runs a world-wide version of Geonet. Its list of recent earthquakes can be found here.
If you want to get updates via email, text message or twitter, you can sign up for alerts from Geonet and from the USGS.
Your sister institutions
You can also directly compare the wiggles on your screen with either the wiggles from the other schools in the network, or with the closest “live” signals that geonet provides. In this last link is a map on the right where you can find the station that is closest to your school.
How to turn off ‘app nap’
On a mac, there is this clever tool to turn off (parts of) applications that the computer thinks you are not using. This tool is called ‘app nap’.
For jamaseis, this has to be turned off. The following video shows how:
(Note: The initial part of the video shows how you can access the relevant settings by right clicking. You may need to hold down the control key on the keyboard while clicking to get to the contextual menus).
createkml.py
createkml.py
A python script that creates a kml representation of earthquake data.
createkml.py expects a path to a csv file of the form created by the Geonet csv export call.
The implementation I use to do this reads the file downloaded by a bash script (running as a cron job)
The essential part of this is
wget -O /PATH/TO/FILE.csv "http://wfs.geonet.org.nz/geonet/ows?service=WFS&version=1.0.0&request=GetFeature&typeName=geonet:quake_search_v1&maxFeatures=50&outputFormat=csv"
The format of the file has the following columns, we are only interested in a few of them (in bold)
FID,
publicid,
eventtype,
origintime,
modificationtime,
latitude,
longitude,
depth,
magnitude,
evaluationmethod,
evaluationstatus,
evaluationmode,
earthmodel,
depthtype,
originerror,
usedphasecount,
usedstationcount,
minimumdistance,
azimuthalgap,
magnitudetype,
magnitudeuncertainty,
magnitudestationcount,
origin_geom
See http://info.geonet.org.nz/
The code
Basic stuff, no data integrity checking (this is part of a pipeline in the local implementation).
#!/usr/bin/python
import argparse
import StringIO
import csv
import datetime
import dateutil.parser
import math
# build the parser
parser = argparse.ArgumentParser(description='Plot earthquakes on a map')
parser.add_argument('filename', help='path/to/csv file')
args = parser.parse_args()
# open the file provided
f = open(args.filename, 'r')
# read it in, and create the basic data we will
# be using
output = StringIO.StringIO(f.read())
# import in csv file format
data = csv.reader(output)
# drop the first line
data.next()
# print out the top of the file
print '<!--?xml version="1.0" encoding="UTF-8"?-->\n\n'
print '\tRecent earthquakes in and around New Zealand'
print '\tSource: GeoNet (www.geonet.org.nz); Created: {}'.format(repr(datetime.datetime.now().isoformat()))
# get the time right noe (UTC)
now = datetime.datetime.utcnow()
# maxdepth is the deepest value
# after which all colour values are clamped
maxdepth = 400.0
for row in data:
# convert the date to something humans understand
whendatetime = dateutil.parser.parse(row[3])
# figure out how far to fade the icon
# clamp this to ~25% minimum
difference = (now - whendatetime).total_seconds();
if difference > 86400:
difference = 86400
elif difference < 0:
difference = 0
# 'shade' is a two character hex value, 3f-ff,
# used as the alpha value in the colour applied
# to the icon
shade = format(255 - int((float(difference)/86400)* 192),'02x')
# Generate a colour value for the icon
# associated with depth.
# The color ramp will be a logarithmic
# progression from 00ff00 (shallow)
# to 0000ff (deep), maxed at maxdepth km?
depth = float(row[7])
# fast at shallow, slow at depth
# multiplier = 255/sqrt(maxdepth)
# depth2 = math.sqrt(depth)*(255/math.sqrt(maxdepth))
# slow at shallow, fast at depth
# divisor = maxdepth/sqrt(255)
# depth2 = (depth/(maxdepth/math.sqrt(255)))**2
# flat
# multiplier = maxdepth/255
depth2 = depth*(255/maxdepth)
if depth2 > 255:
depth2 = 255.0
elif depth2 < 0:
depth2 = 0.0
if depth2 < 128:
green = 'ff'
red = format(int(depth2*2),'02x')
else:
green = format(255-int((depth2-128)*2),'02x')
red = 'ff'
# round magnitude to determine the icon style
magnitude = float(row[8]);
magnitudelow = int(math.floor(magnitude))
if magnitudelow > 9:
magnitudelow = 9
elif magnitudelow < 0:
magnitudelow = 0
description = '<![CDATA[\n
<div style="text-align: left;">'
description += '<a href="http://www.geonet.org.nz/quakes/region/newzealand/' + row[1] + '" target="' + row[1] + '"><b>' + row[1] + '</b></a>'
description += '\n
<b>' + whendatetime.strftime('%H:%M, %d %B %Y') + '</b> (UTC)'
description += '\n
magnitude: <b>' + str(round(float(row[8]),2)) + '</b>'
description += '\n
depth: <b>' + str(round(float(row[7]),2)) + 'km</b>'
description += '</div>
]]>'
print '\t'
print '\t\t' + description + ''
print '\t\t' print '\t\t\n\t\t\t' + row[6] + ',' + row[5] + ',0' print '\t\t\n\t' # print out the bottom of the file print '\n\n'
The script dumps its output to standard output, so I generally redirect this to a file.
Correct magnet positions
There are three magnets suspended from the slinky in the TC1. The first two are centred in the coil. Motion of these magnets from earthquakes are responsible for the induced current in the coil. The third magnet is suspended in the copper tube, and dampens the system via Lenz’s Law.
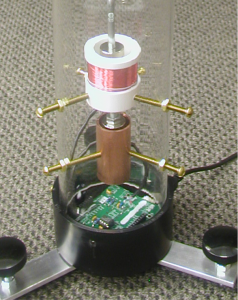
The pair of magnets in the coil, and the single magnet in the copper pipe should not touch the coil and tube, respectively, and their tops should be flush with the coil/tube, as shown in the picture.
If the magnets are not in the right vertical position, you can adjust the magnets by threading the screw on the lid up or down. If you need even more vertical adjustment, you can bunch or release rungs clamped in the lid of TC1.
If the magnets are not in the right horizontal position, adjust the knobs on the legs.
Why is my station’s snapshot not up to date?
If the screenshot of your station is not updating here, consider the following:
- Is your computer still on? In principle, it can’t be off is power is available: the bios should be set that the machine comes on after a power failure.
- Is your computer on the network? For macs, you can troubleshoot a wireless connection here, or trouble shoot in general from System Preferences > Network > Assist Me > Diagnostics.
- Is Jamaseis still running? Jamaseis should be in your startup menu, so that if the computer comes (back) on, so does jamaseis.
If the answer to the three questions is “yes”, check your log file (under the window menu in jamaseis). If you see an error that you can fix, great. If not, send us the log file and restart jamaseis.
Is the TC1 set up right?
If you are unsure if the TC1 is balanced and set up correctly, visit this post
Setting up a source in jAmaseis
The TC-1


Location
There are a couple of ways of getting good location information suitable for configuring jAmaseis. The software needs a longitude, latitude and altitude value. Where these are accurately known on a number of stations, it is easier to calculate good magnitude and depth values for events observed on multiple stations.
How accurate should it be? At the latitude of the example discussed in this article, each degree East or West is ~90km (at the equator, a degree is ~111km), so the 4 decimal places used below suggests an accuracy of ~0.010m for longitude. Latitude is similar.
iPhone (or similar)
Assuming you are close to or on the point where the TC-1 will be deployed, your GPS enabled phone/pad/computer can give you suitable coordinates.
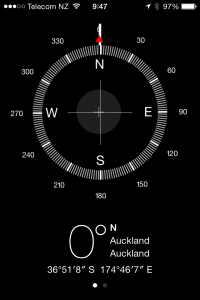
jAmaseis wants decimal values for longitude and latitude, so you need to do a bit of maths. Latitude is how far up (+) or down (-) you are on the arc joining the North pole (90ºN or 90º) to the South pole (90ºS or -90º) running though your location. In the example above, my latitude is 36º51’8”S (degrees, minutes, seconds South), which can be converted to
36 + 51/60 + 8/(60*60) x -1 ≈ -35.8522
(the -1 is due to the S)
Longitude is how far East (+) or West (-) around the Earth you are on a circle parallel to the equator (where all points on the circle share the same latitude) where 0 is the intersection of the arc running between the North and South poles intersecting the Royal Observatory at Greenwich. In the example above, my longitude is 174º46’7”E (degrees, minutes, seconds East), which can be converted to
174 + 46/60 + 7/(60 x 60) ≈ 174.7686
Google Maps
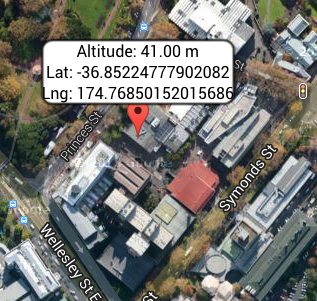
If you know here your seismometer is, then you can use Google maps. Centre the map above your target location and copy the longitude and latitude from address bar.
If your machine has the capability, Google Maps can use location services to centre the map.
Altitude
jAmaseis
When you plug your seismometer in, your computer may ask about a new network or communications device -ignore it (close it, whatever)
The port you use is important -if you change it, you may need to reconfigure the source (so jAmaseis can find it again). On the Macs we are deploying, we will typically use the USB port closest to the power socket. The TC-1 needs power, so it is best not to use one of the ports on a keyboard (if you have such a keyboard).
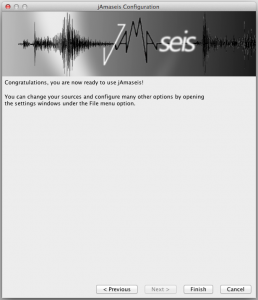
Assuming jAmaseis is already installed, you can run the Source configuration wizard from the File menu.
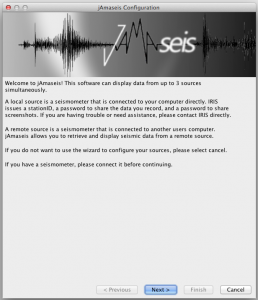
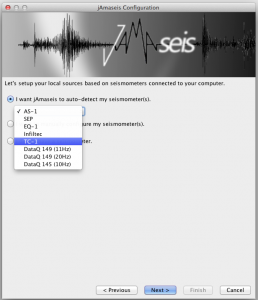

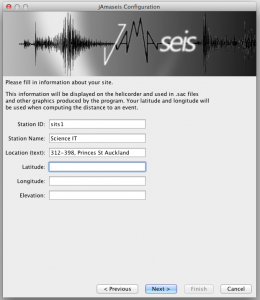
Sort out your location (see above)


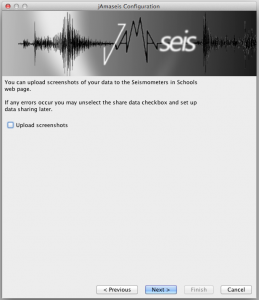
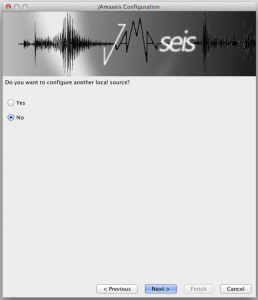
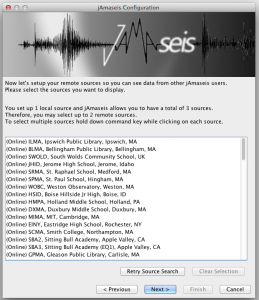

Screen shots
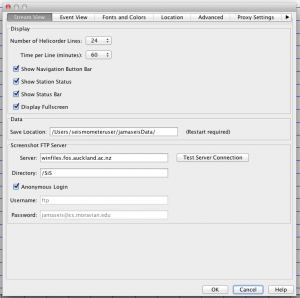
Let’s change the FTP target … The settings dialogue accessed through the file menu, offers places to configure this.
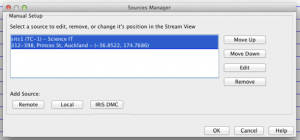
To switch upload back on, select Manage sources from the File menu.


Earthquakes
The last 50 earthquakes in and around New Zealand
(regenerated from the data every 10 minutes or so)

