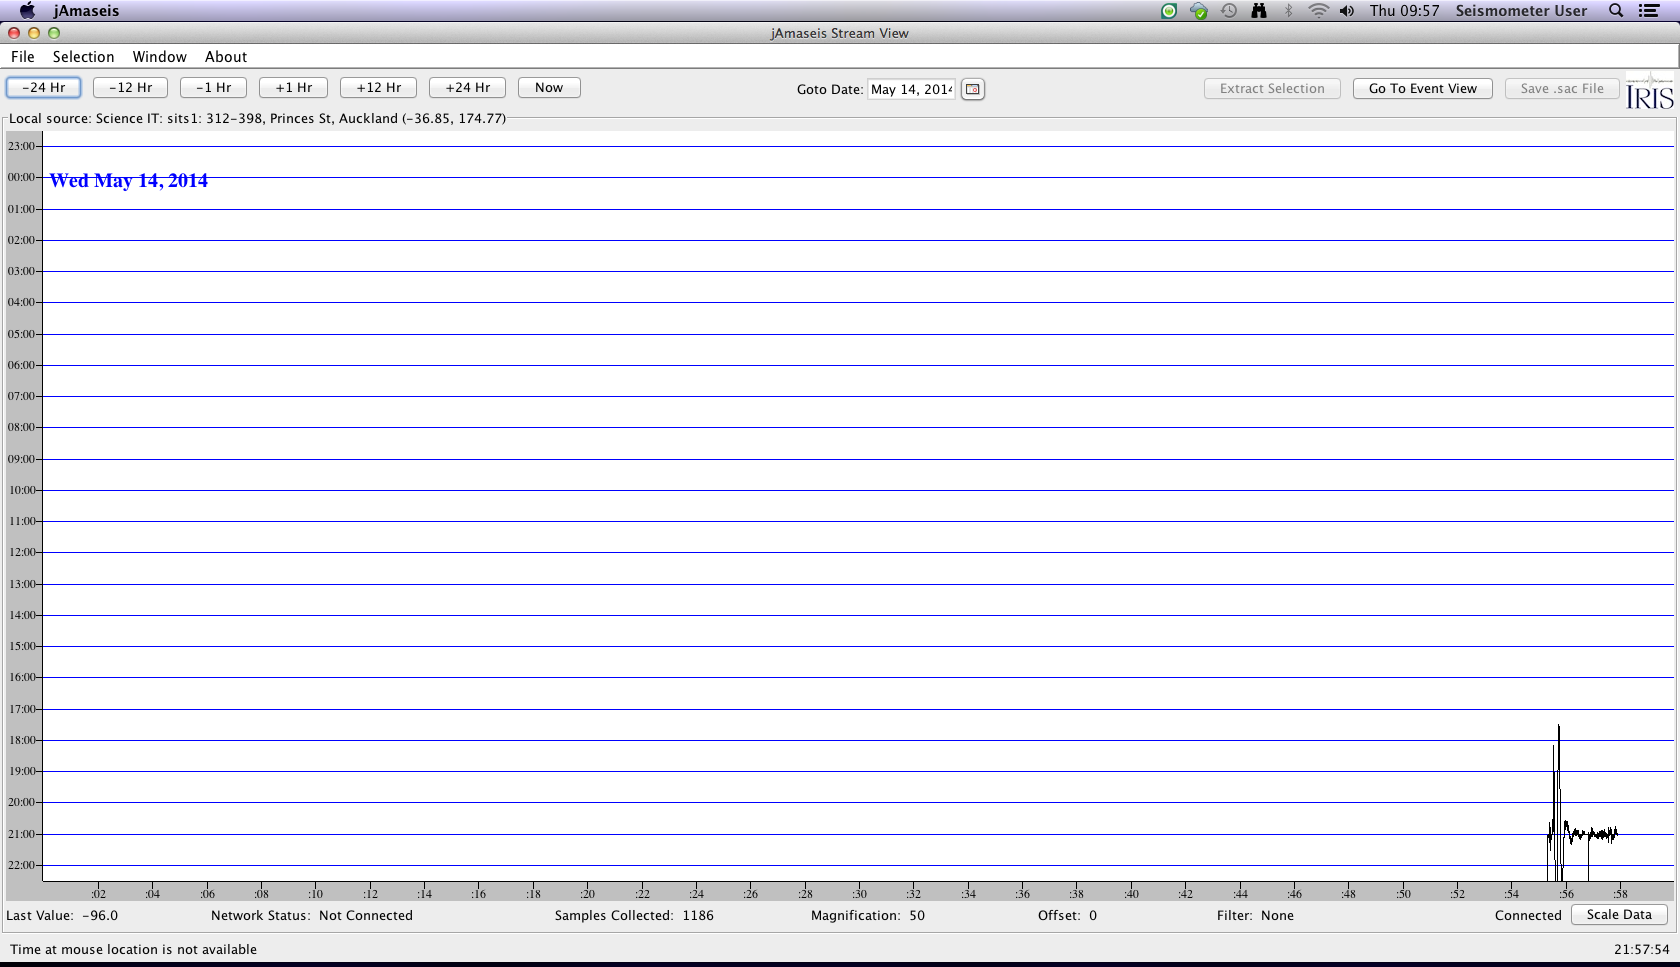
Given the usual limitations of our (vertical) sensor when it comes to S-wave recordings, this is indicative of a very deep earthquake. The USGS estimates that this earthquake happened at a depth of 460 km. Now, under most places on Earth the rocks at those depths are too ductile to support the brittle breaking necessary for an earthquake, but in this case, the earthquake happened in — or on the boundary of — the brittle Pacific Plate subducted under the Australian Plate. Note that the epicentre of this event is about 500 km from the surface expression of the boundary between these plates. From the depth of the event and the offset to the plate boundary at the surface, we can estimate the angle of subduction may be around 45 degrees.
The P- and S-wave markers are based on the average wave speed in the earth. In this case, they are a bit earlier than expected, because the subsurface between earthquake and the AUCK recording station is slower than average. As discussed previously, this is indicative of a young, warmer (and thus slower) lithosphere.
Furthermore, such deep earthquakes cause relatively little surface wave energy. The signal after the S-waves is likely a guided wave in the Pacific plate called a “leaky mode.” If you want to learn more about leaky modes in the Kermadecs, you should read this paper.
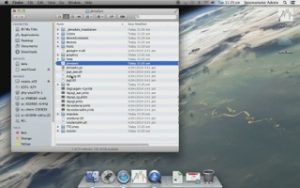
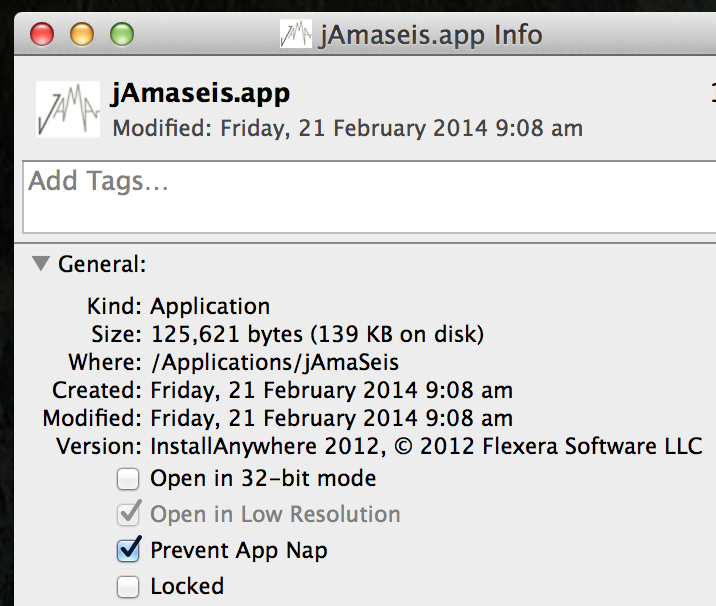
On a mac, there is this clever tool to turn off (parts of) applications that the computer thinks you are not using. This tool is called ‘app nap’.
For jamaseis, this has to be turned off. The following video shows how:
(Note: The initial part of the video shows how you can access the relevant settings by right clicking. You may need to hold down the control key on the keyboard while clicking to get to the contextual menus).
Basic stuff, no data integrity checking (this is part of a pipeline in the local implementation).
#!/usr/bin/python
import argparse
import StringIO
import csv
import datetime
import dateutil.parser
import math
# build the parser
parser = argparse.ArgumentParser(description='Plot earthquakes on a map')
parser.add_argument('filename', help='path/to/csv file')
args = parser.parse_args()
# open the file provided
f = open(args.filename, 'r')
# read it in, and create the basic data we will
# be using
output = StringIO.StringIO(f.read())
# import in csv file format
data = csv.reader(output)
# drop the first line
data.next()
# print out the top of the file
print '<!--?xml version="1.0" encoding="UTF-8"?-->\n\n'
print '\tRecent earthquakes in and around New Zealand'
print '\tSource: GeoNet (www.geonet.org.nz); Created: {}'.format(repr(datetime.datetime.now().isoformat()))
# get the time right noe (UTC)
now = datetime.datetime.utcnow()
# maxdepth is the deepest value
# after which all colour values are clamped
maxdepth = 400.0
for row in data:
# convert the date to something humans understand
whendatetime = dateutil.parser.parse(row[3])
# figure out how far to fade the icon
# clamp this to ~25% minimum
difference = (now - whendatetime).total_seconds();
if difference > 86400:
difference = 86400
elif difference < 0:
difference = 0
# 'shade' is a two character hex value, 3f-ff,
# used as the alpha value in the colour applied
# to the icon
shade = format(255 - int((float(difference)/86400)* 192),'02x')
# Generate a colour value for the icon
# associated with depth.
# The color ramp will be a logarithmic
# progression from 00ff00 (shallow)
# to 0000ff (deep), maxed at maxdepth km?
depth = float(row[7])
# fast at shallow, slow at depth
# multiplier = 255/sqrt(maxdepth)
# depth2 = math.sqrt(depth)*(255/math.sqrt(maxdepth))
# slow at shallow, fast at depth
# divisor = maxdepth/sqrt(255)
# depth2 = (depth/(maxdepth/math.sqrt(255)))**2
# flat
# multiplier = maxdepth/255
depth2 = depth*(255/maxdepth)
if depth2 > 255:
depth2 = 255.0
elif depth2 < 0:
depth2 = 0.0
if depth2 < 128:
green = 'ff'
red = format(int(depth2*2),'02x')
else:
green = format(255-int((depth2-128)*2),'02x')
red = 'ff'
# round magnitude to determine the icon style
magnitude = float(row[8]);
magnitudelow = int(math.floor(magnitude))
if magnitudelow > 9:
magnitudelow = 9
elif magnitudelow < 0:
magnitudelow = 0
description = '<![CDATA[\n
<div style="text-align: left;">'
description += '<a href="http://www.geonet.org.nz/quakes/region/newzealand/' + row[1] + '" target="' + row[1] + '"><b>' + row[1] + '</b></a>'
description += '\n
<b>' + whendatetime.strftime('%H:%M, %d %B %Y') + '</b> (UTC)'
description += '\n
magnitude: <b>' + str(round(float(row[8]),2)) + '</b>'
description += '\n
depth: <b>' + str(round(float(row[7]),2)) + 'km</b>'
description += '</div>
]]>'
print '\t'
print '\t\t' + description + ''
print '\t\t' print '\t\t\n\t\t\t' + row[6] + ',' + row[5] + ',0' print '\t\t\n\t' # print out the bottom of the file print '\n\n'
The script dumps its output to standard output, so I generally redirect this to a file.
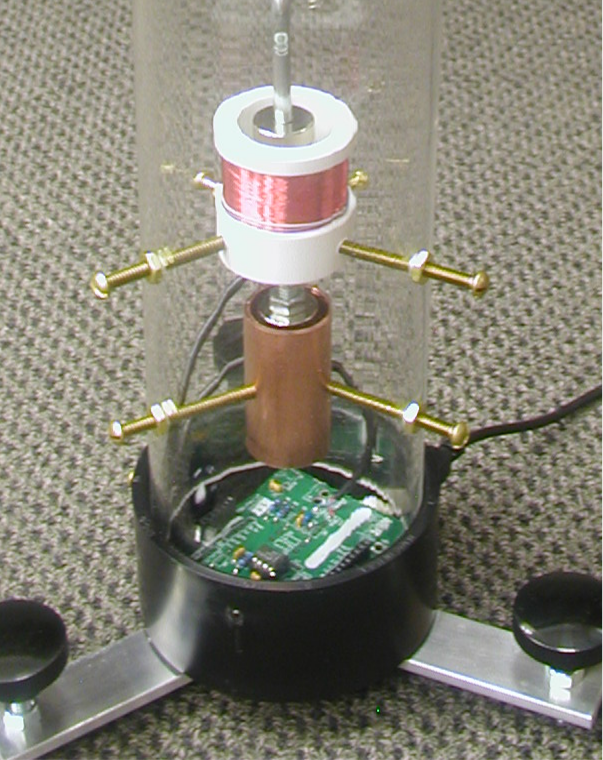
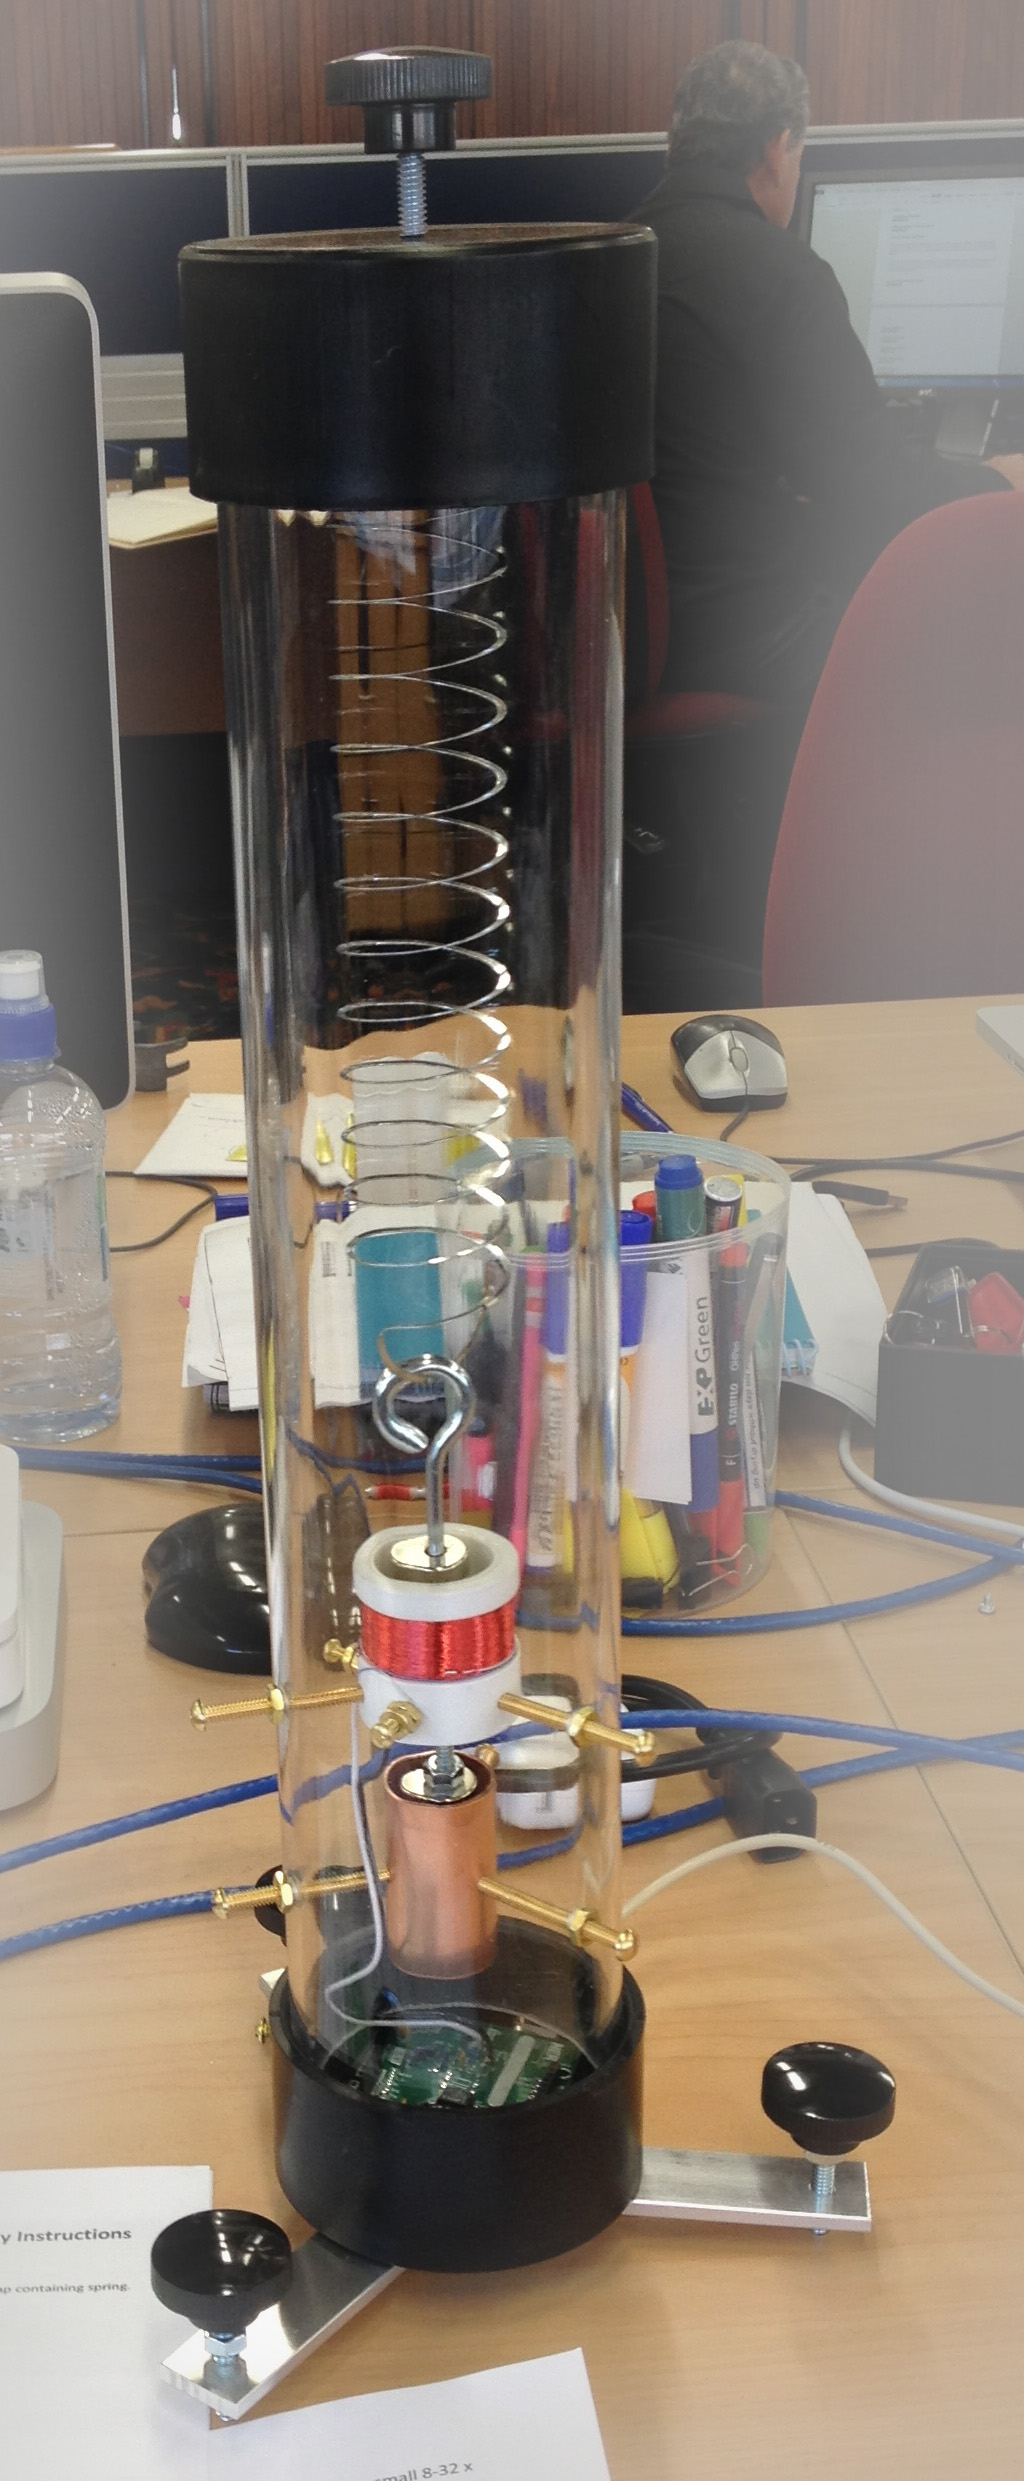
There are three magnets suspended from the slinky in the TC1. The first two are centred in the coil. Motion of these magnets from earthquakes are responsible for the induced current in the coil. The third magnet is suspended in the copper tube, and dampens the system via Lenz’s Law.
Correct magnet positions. Click on the image for a closer-up view.
The pair of magnets in the coil, and the single magnet in the copper pipe should not touch the coil and tube, respectively, and their tops should be flush with the coil/tube, as shown in the picture.
If the magnets are not in the right vertical position, you can adjust the magnets by threading the screw on the lid up or down. If you need even more vertical adjustment, you can bunch or release rungs clamped in the lid of TC1.
If the magnets are not in the right horizontal position, adjust the knobs on the legs.
If the screenshot of your station is not updating here, consider the following:
Is your computer still on? In principle, it can’t be off is power is available: the bios should be set that the machine comes on after a power failure.
Is your computer on the network? For macs, you can troubleshoot a wireless connection here, or trouble shoot in general from System Preferences > Network > Assist Me > Diagnostics.
Is Jamaseis still running? Jamaseis should be in your startup menu, so that if the computer comes (back) on, so does jamaseis.
If the answer to the three questions is “yes”, check your log file (under the window menu in jamaseis). If you see an error that you can fix, great. If not, send us the log file and restart jamaseis.
Is the TC1 set up right?
If you are unsure if the TC1 is balanced and set up correctly, visit this post
Our TC-1 came as a kitand was very easy to complete
Location
There are a couple of ways of getting good location information suitable for configuring jAmaseis. The software needs a longitude, latitude and altitude value. Where these are accurately known on a number of stations, it is easier to calculate good magnitude and depth values for events observed on multiple stations.
How accurate should it be? At the latitude of the example discussed in this article, each degree East or West is ~90km (at the equator, a degree is ~111km), so the 4 decimal places used below suggests an accuracy of ~0.010m for longitude. Latitude is similar.
iPhone (or similar)
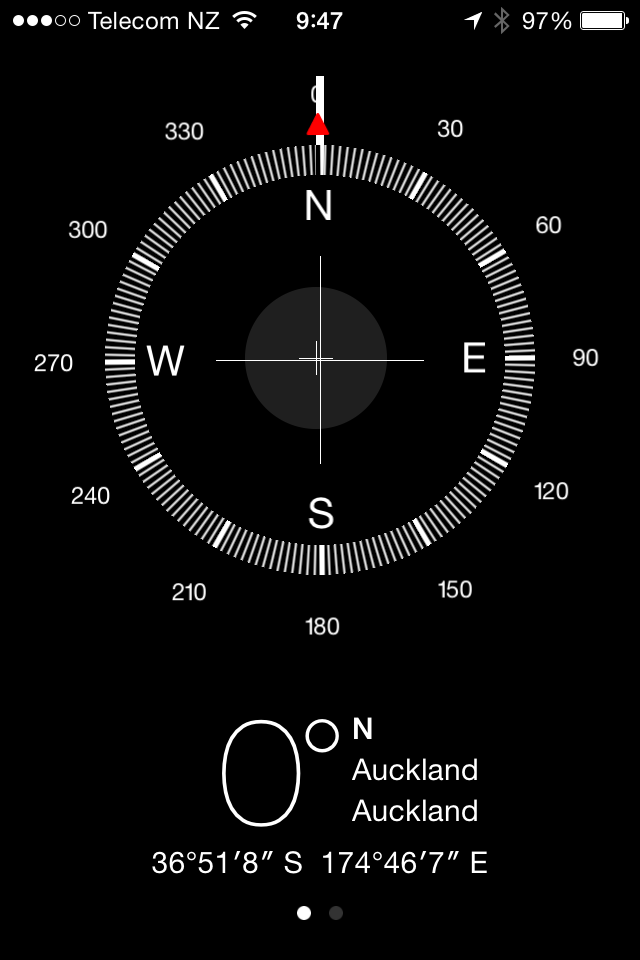
Assuming you are close to or on the point where the TC-1 will be deployed, your GPS enabled phone/pad/computer can give you suitable coordinates.
The compass provides longitude and latitude
jAmaseis wants decimal values for longitude and latitude, so you need to do a bit of maths. Latitude is how far up (+) or down (-) you are on the arc joining the North pole (90ºN or 90º) to the South pole (90ºS or -90º) running though your location. In the example above, my latitude is 36º51’8”S (degrees, minutes, seconds South), which can be converted to
36 + 51/60 + 8/(60*60) x -1≈ -35.8522
(the -1 is due to the S)
Longitude is how far East (+) or West (-) around the Earth you are on a circle parallel to the equator (where all points on the circle share the same latitude) where 0 is the intersection of the arc running between the North and South poles intersecting the Royal Observatory at Greenwich. In the example above, my longitude is 174º46’7”E (degrees, minutes, seconds East), which can be converted to
174 + 46/60 + 7/(60 x 60) ≈ 174.7686
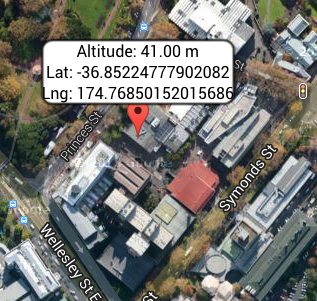
Google Maps
If you know here your seismometer is, then you can use Google maps. Centre the map above your target location and copy the longitude and latitude from address bar.
If your machine has the capability, Google Maps can use location services to centre the map.
A Google Maps like interface allows you to locate and find an altitude!
jAmaseis
When you plug your seismometer in, your computer may ask about a new network or communications device -ignore it (close it, whatever)
The port you use is important -if you change it, you may need to reconfigure the source (so jAmaseis can find it again). On the Macs we are deploying, we will typically use the USB port closest to the power socket. The TC-1 needs power, so it is best not to use one of the ports on a keyboard (if you have such a keyboard).
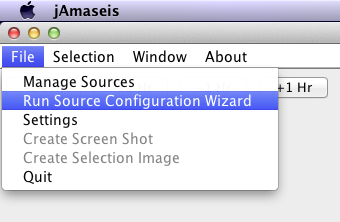
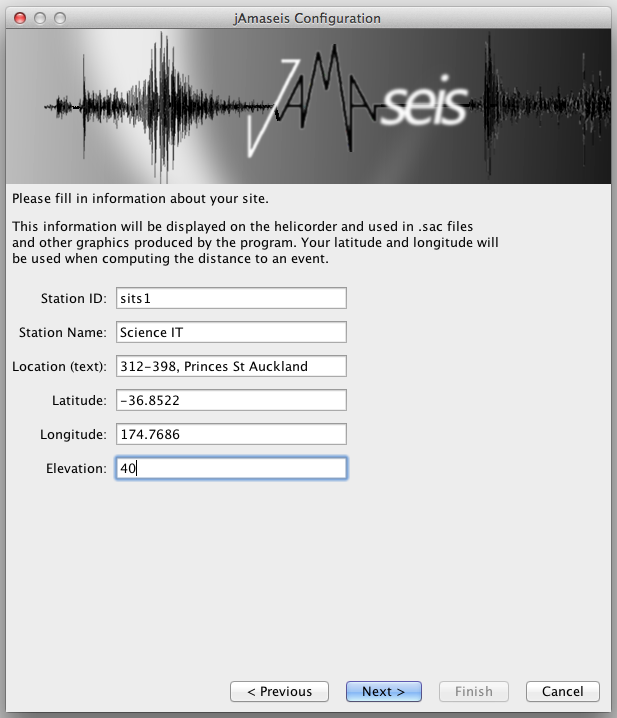
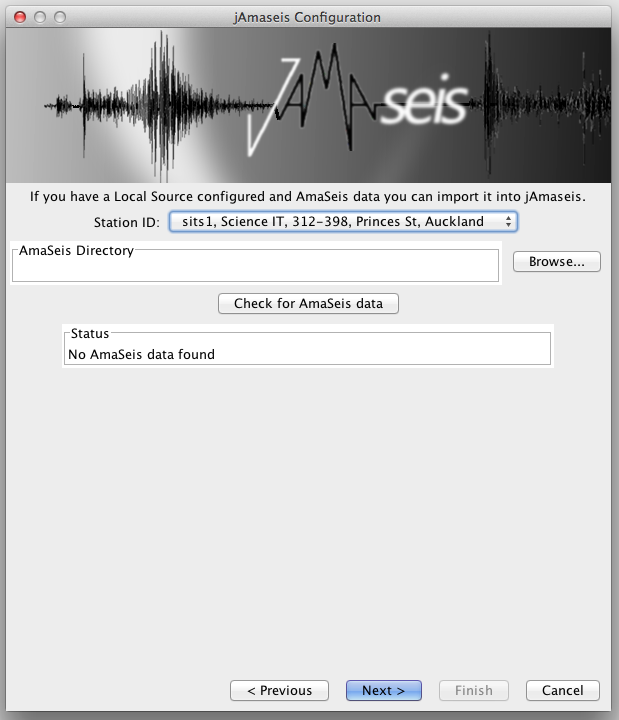
Assuming jAmaseis is already installed, you can run the Source configuration wizard from the File menu.
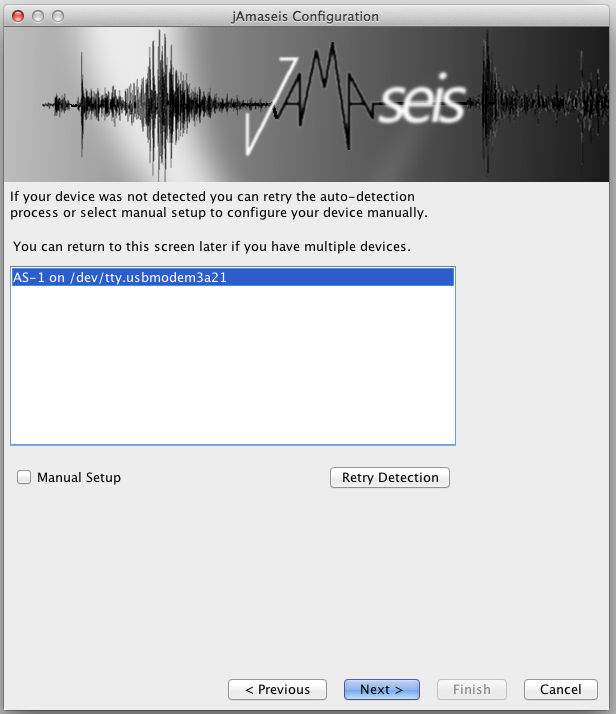
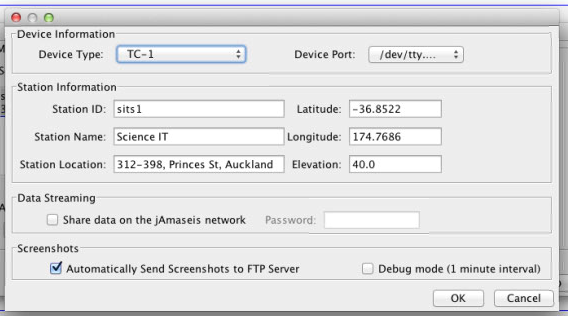
next…Choose the appropriate seismometer type and modelChoose the device…Fill in the details
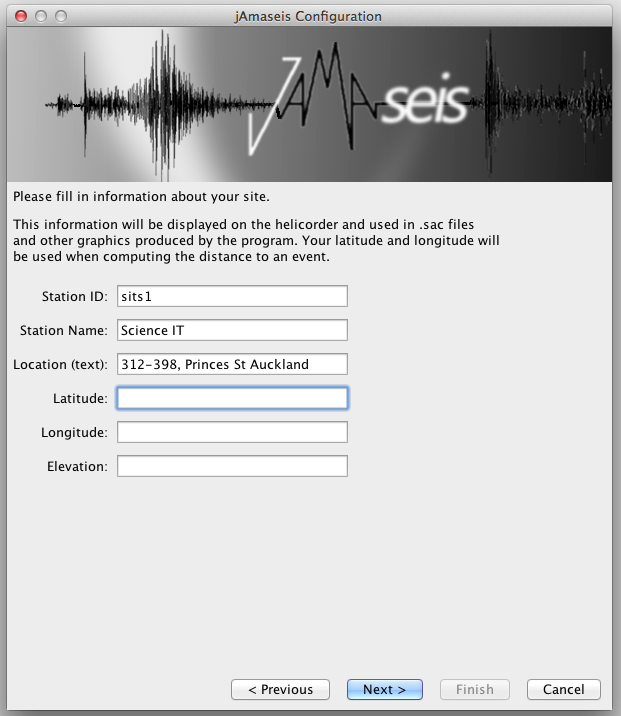
Sort out your location (see above)
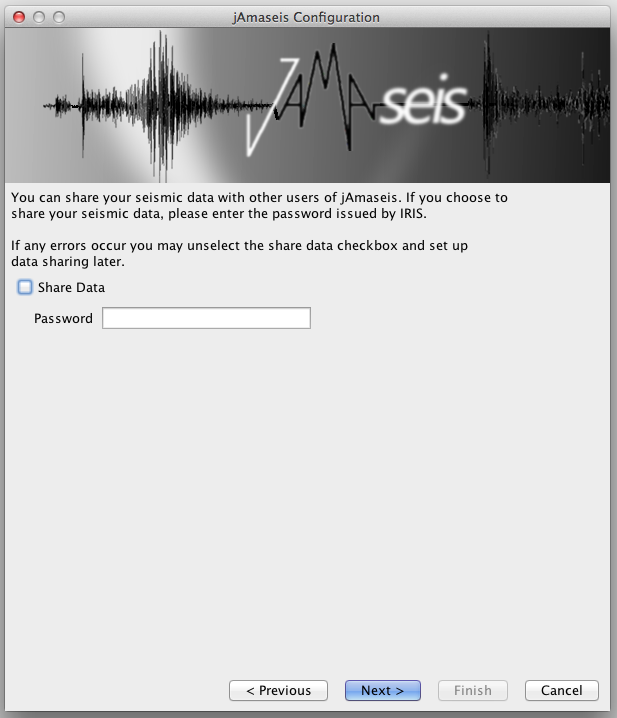
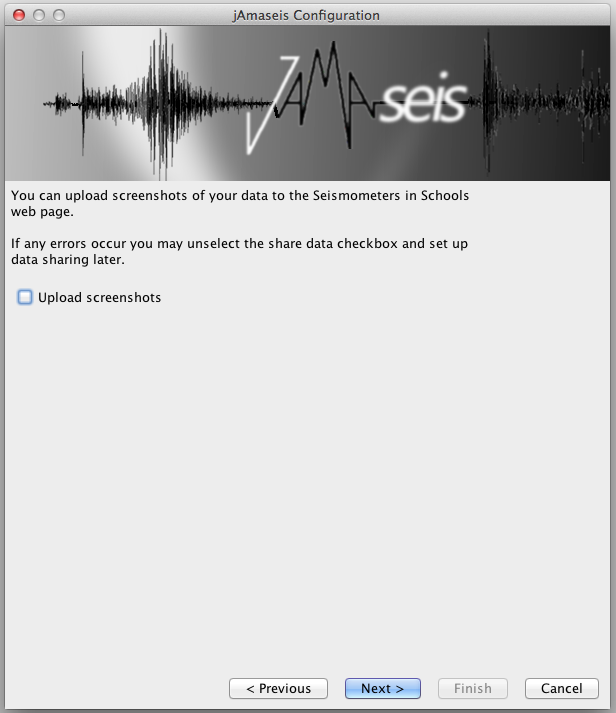
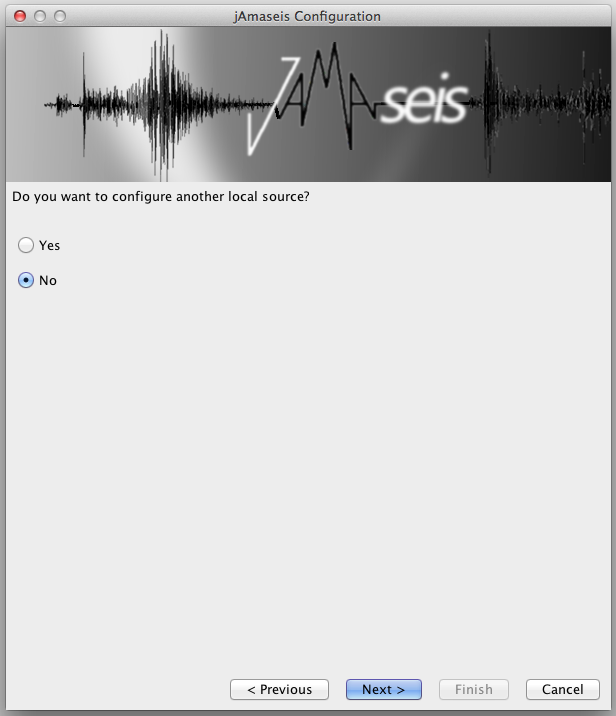
Fill in the longitude and latitude … Next …Untick for nowditto -we will put this back laterNot right now thanks…Up to you, but these can be confusing when you’re setting up…I did not have data from another machine, so stepped past this -use at your discretionDone!
Screen shots
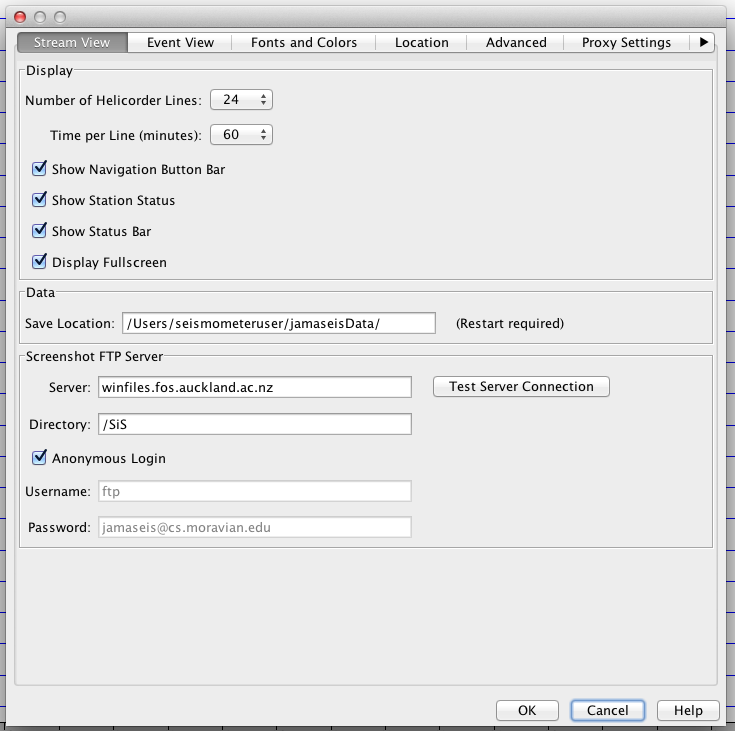
Let’s change the FTP target … The settings dialogue accessed through the file menu, offers places to configure this.
Configure upload settings, etc
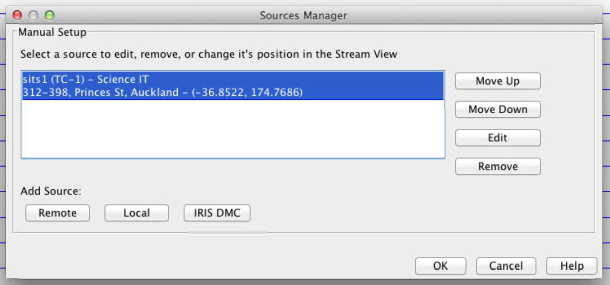
To switch upload back on, select Manage sources from the File menu.
Manage sourcesAutomatically send screenshots to FTP serverUp and running…
TC-1 on the left, connected through an Arduino and amplifier to the iMac
hardware
21″ iMac, c2008 model
3GB RAM
320GB HDD (divided into system and data partitions)
software environment
MacOS X 10.9.x
ESET NOD32 – antivirus
Casper client – platform management
Current JRE 7, JRE 6 (Arduino)
jAmaseis
Arduino IDE/drivers
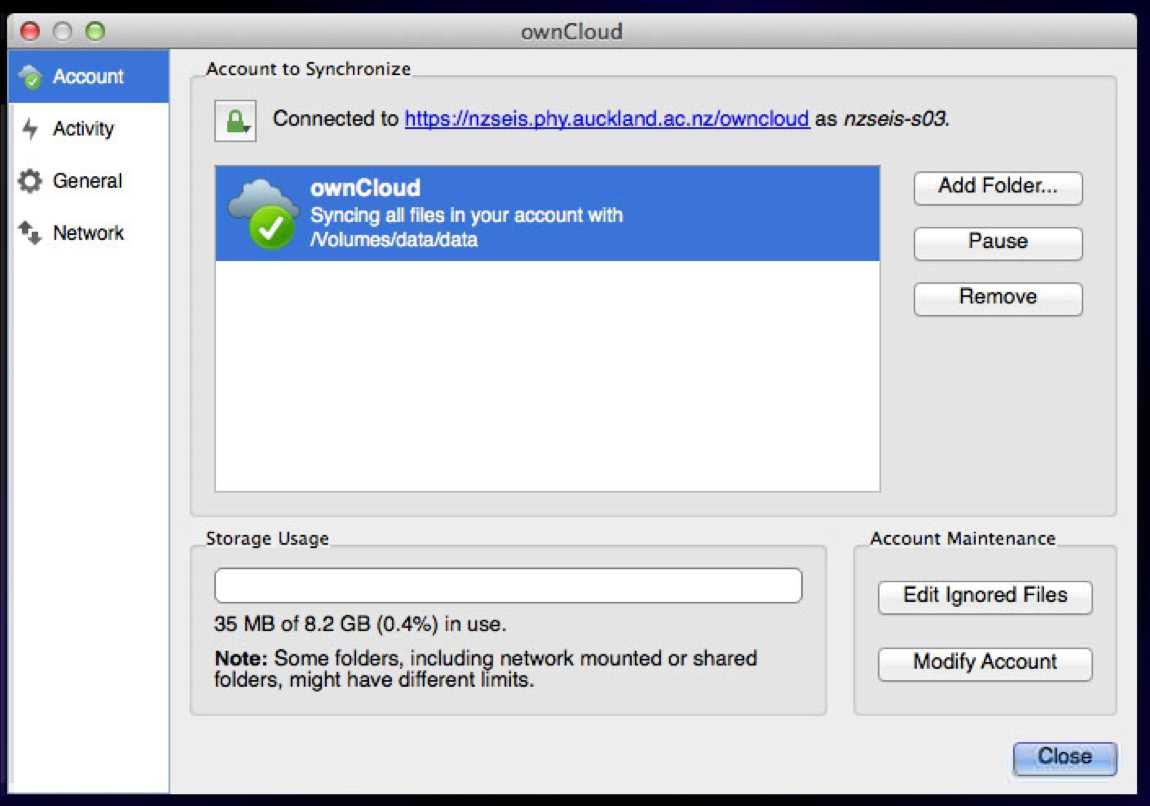
Owncloud desktop client – synchronization/backup
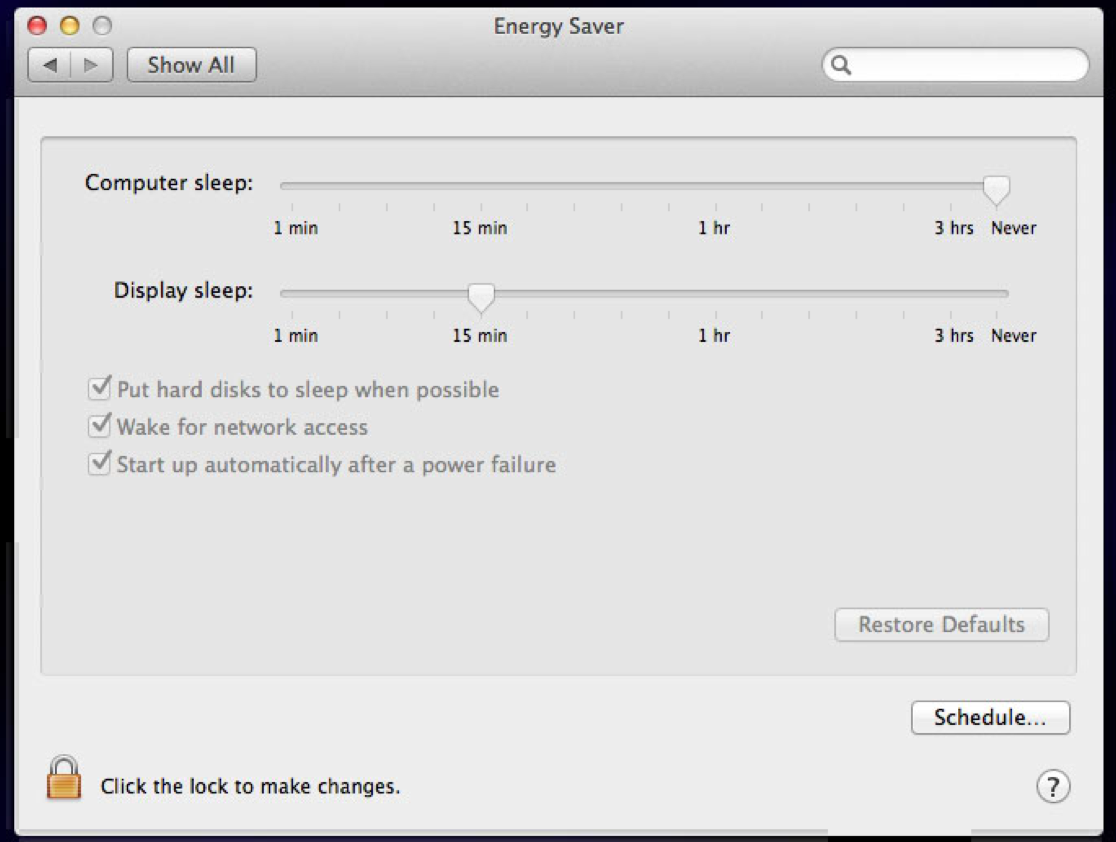
Energy Saver T
he energy saver settings are applied to the iMac using a policy in our Mac management tool, Casper (not to be confused with Kasper!). Even if these settings are modified by a local administrator, they will revert to those shown above when Casper refreshes the policy on the machine -if a School using one of these,needs us to modify the settings, we can unlock the policy -let Kasper know.
(italicised items are specific components of the University platform being used here and NOT requirements for the basic seismograph)
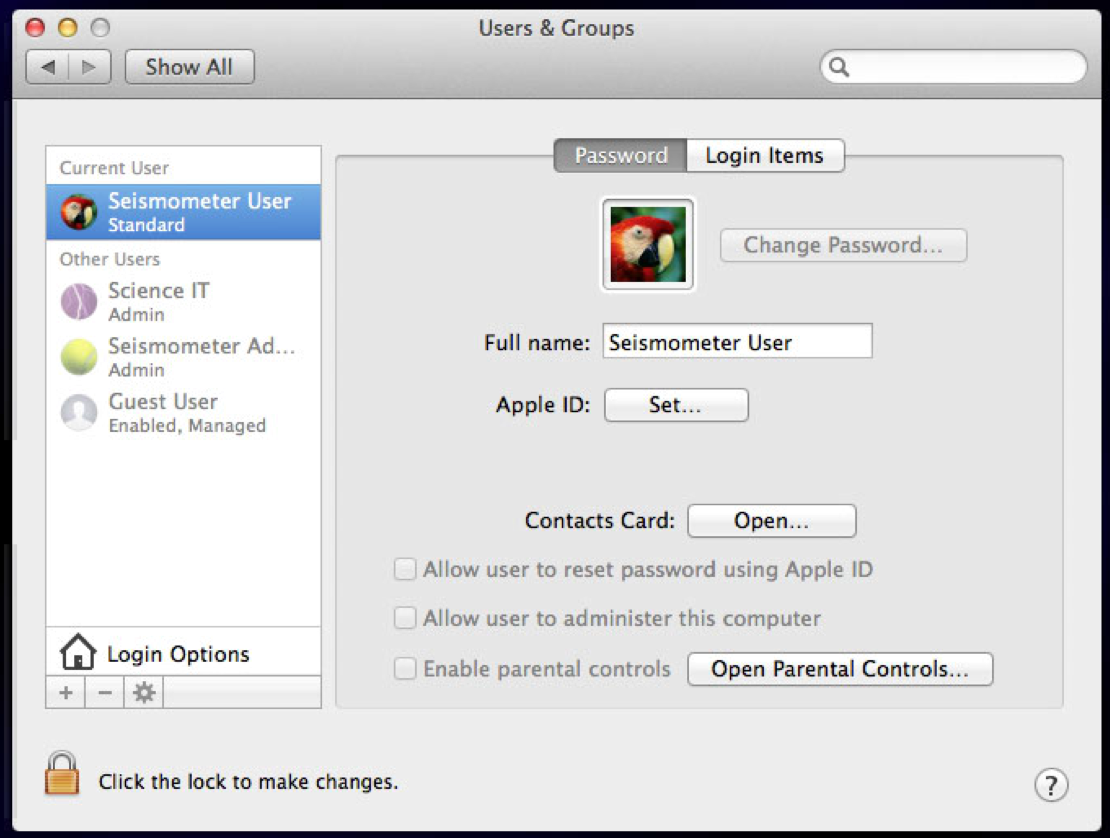
user configuration
scienceit
Standard administrative user account used to manage Macs in Science at the University of Auckland. Used for remote management, updates, etc.
seismometeradmin
An administrative account for the project participants -used to install and upgrade the software specific to the project.
seismometeruser
The workhorse account. A standard user.
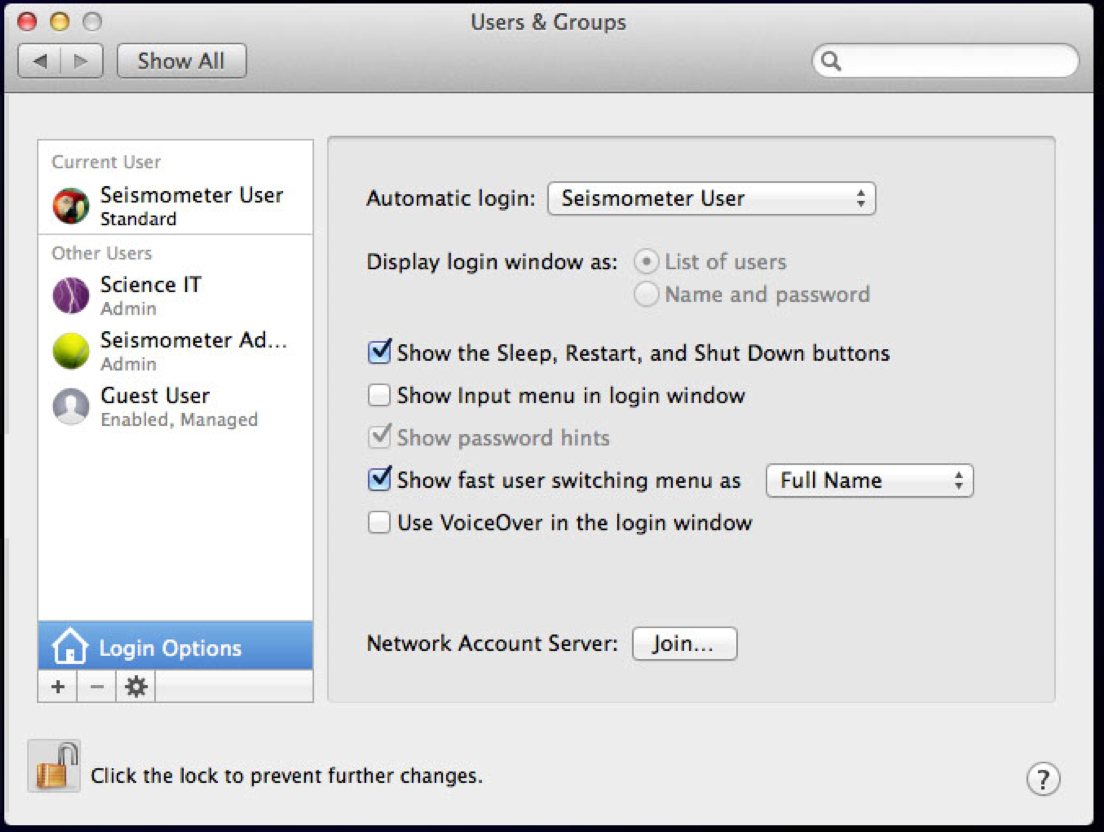
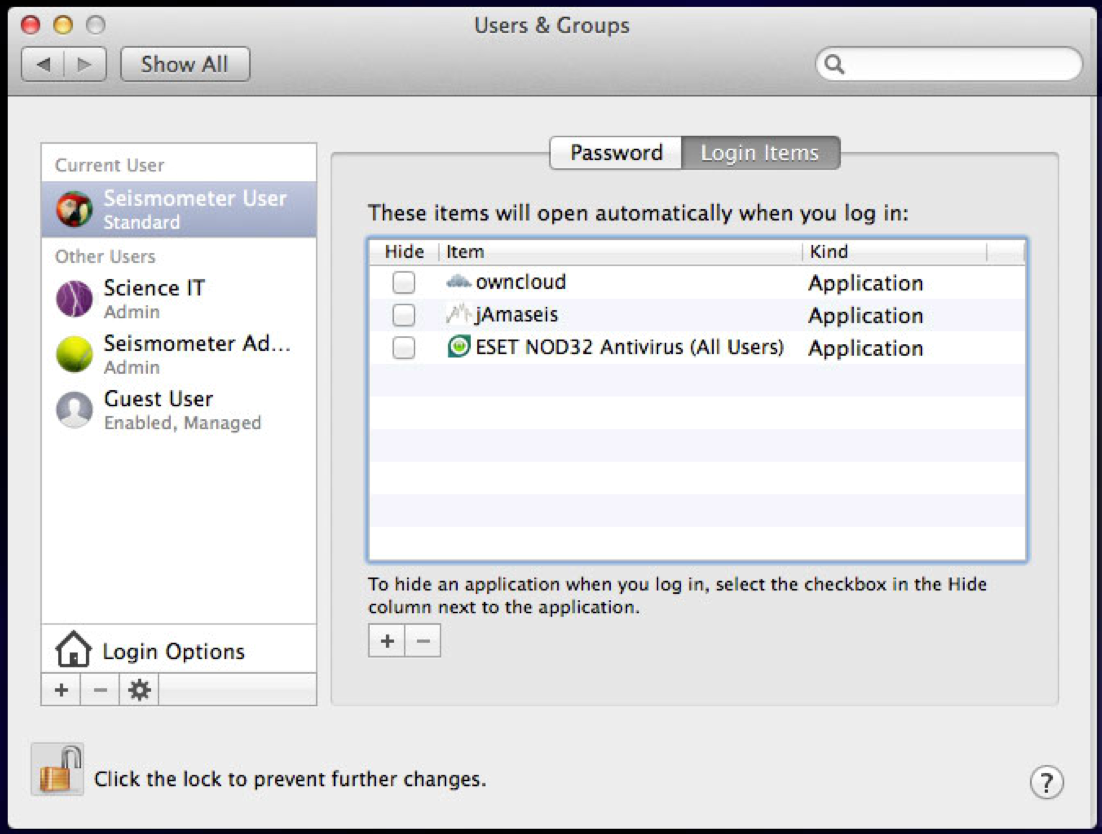
seismometeruser environment
Automatic log in
Login items
Dock
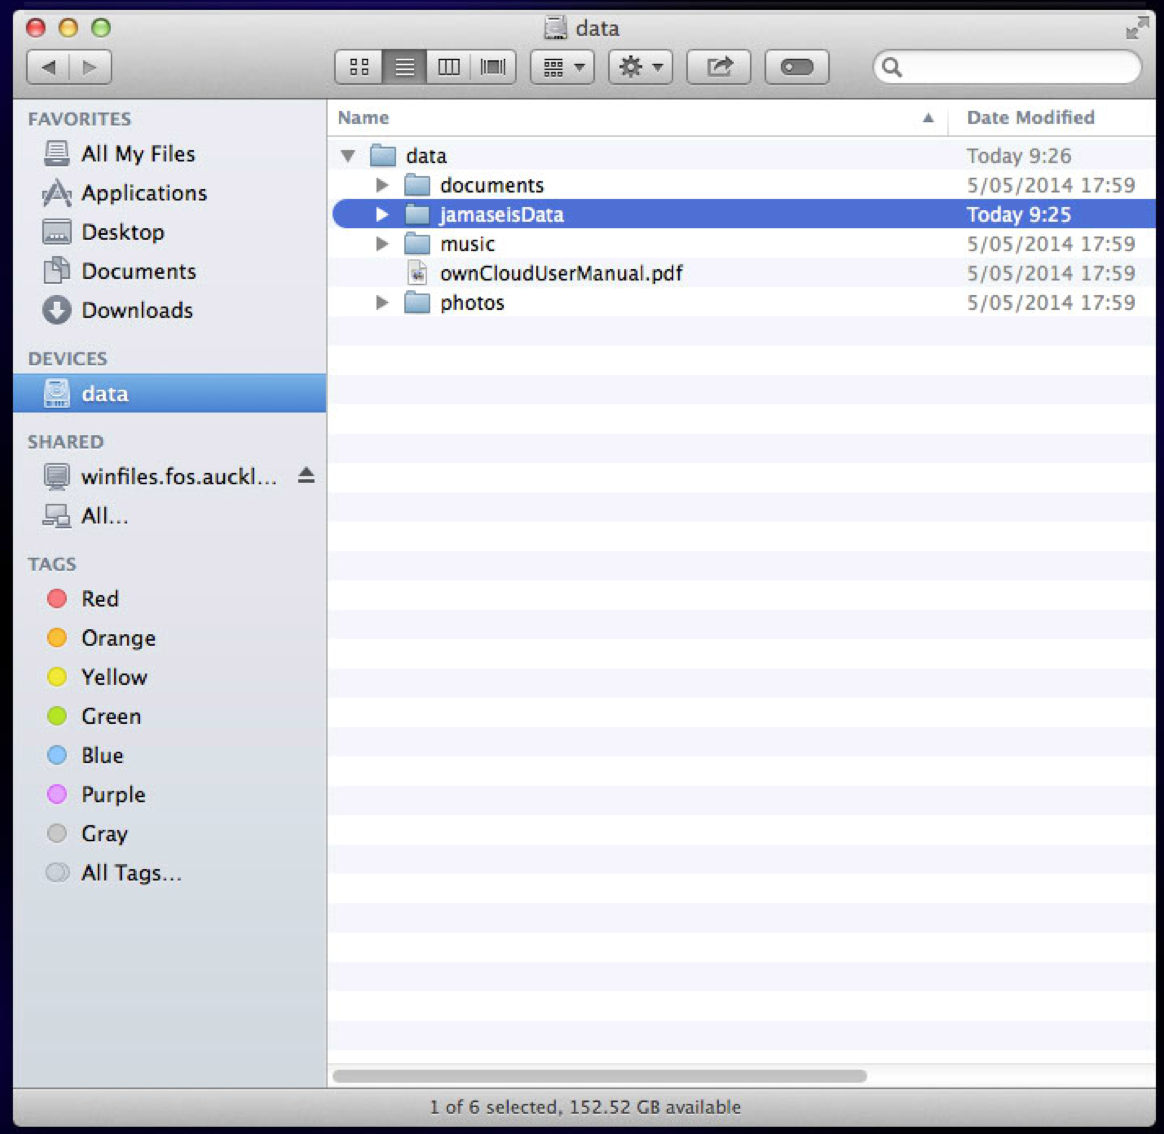
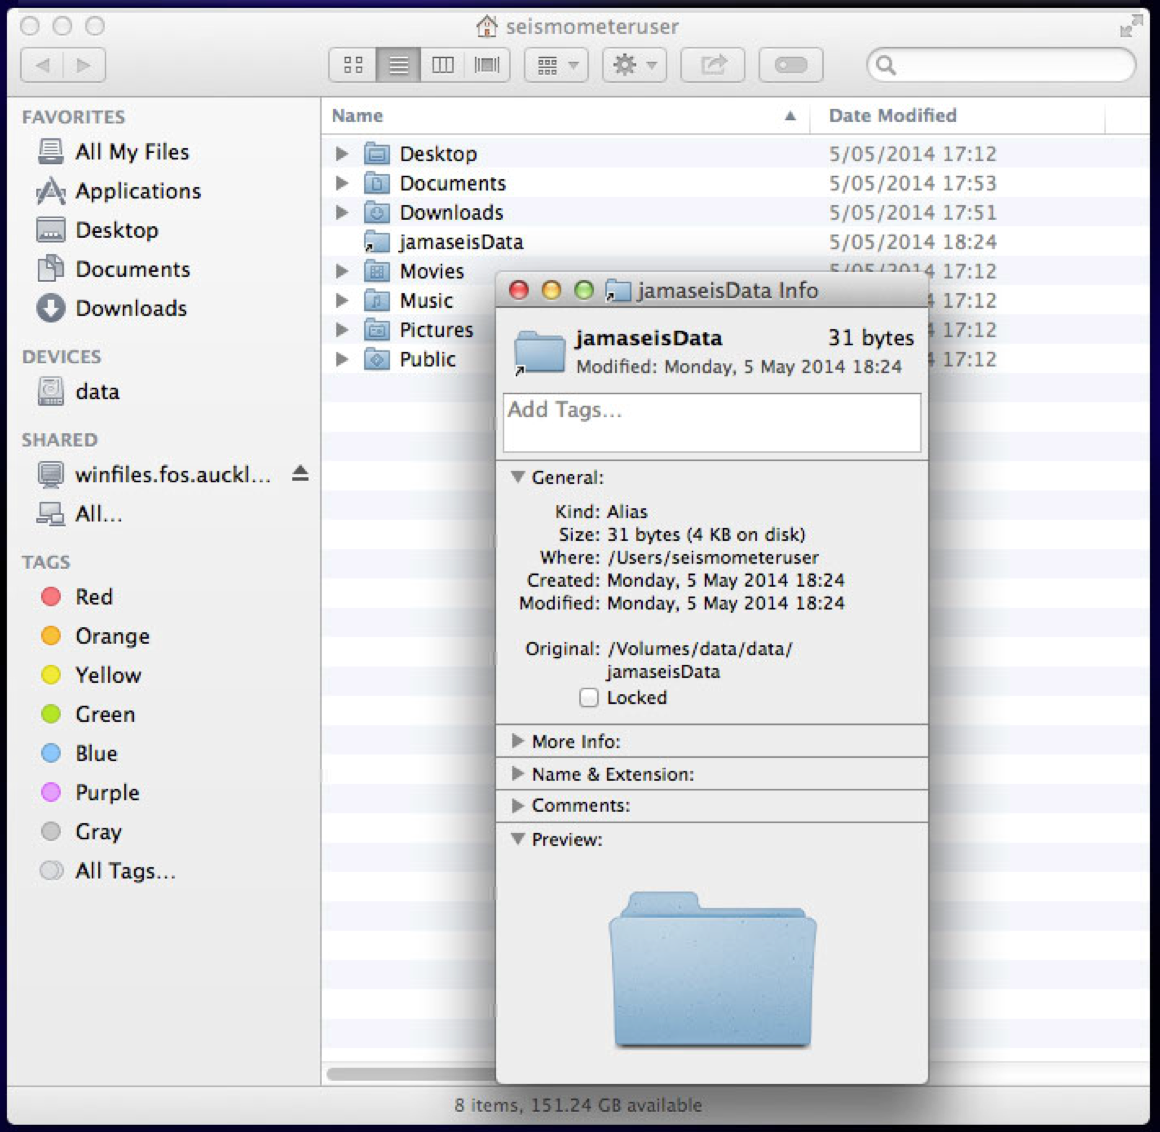
Owncloud configure Owncloud to synchronize /Volumes/data/data